ROLE
UX Researcher - Product Designer - Content Strategist
DURATION
3 Months
TOOLS
Figma, Adobe Illustrator, Adobe Photoshop, Adobe After Effects
OVERVIEW
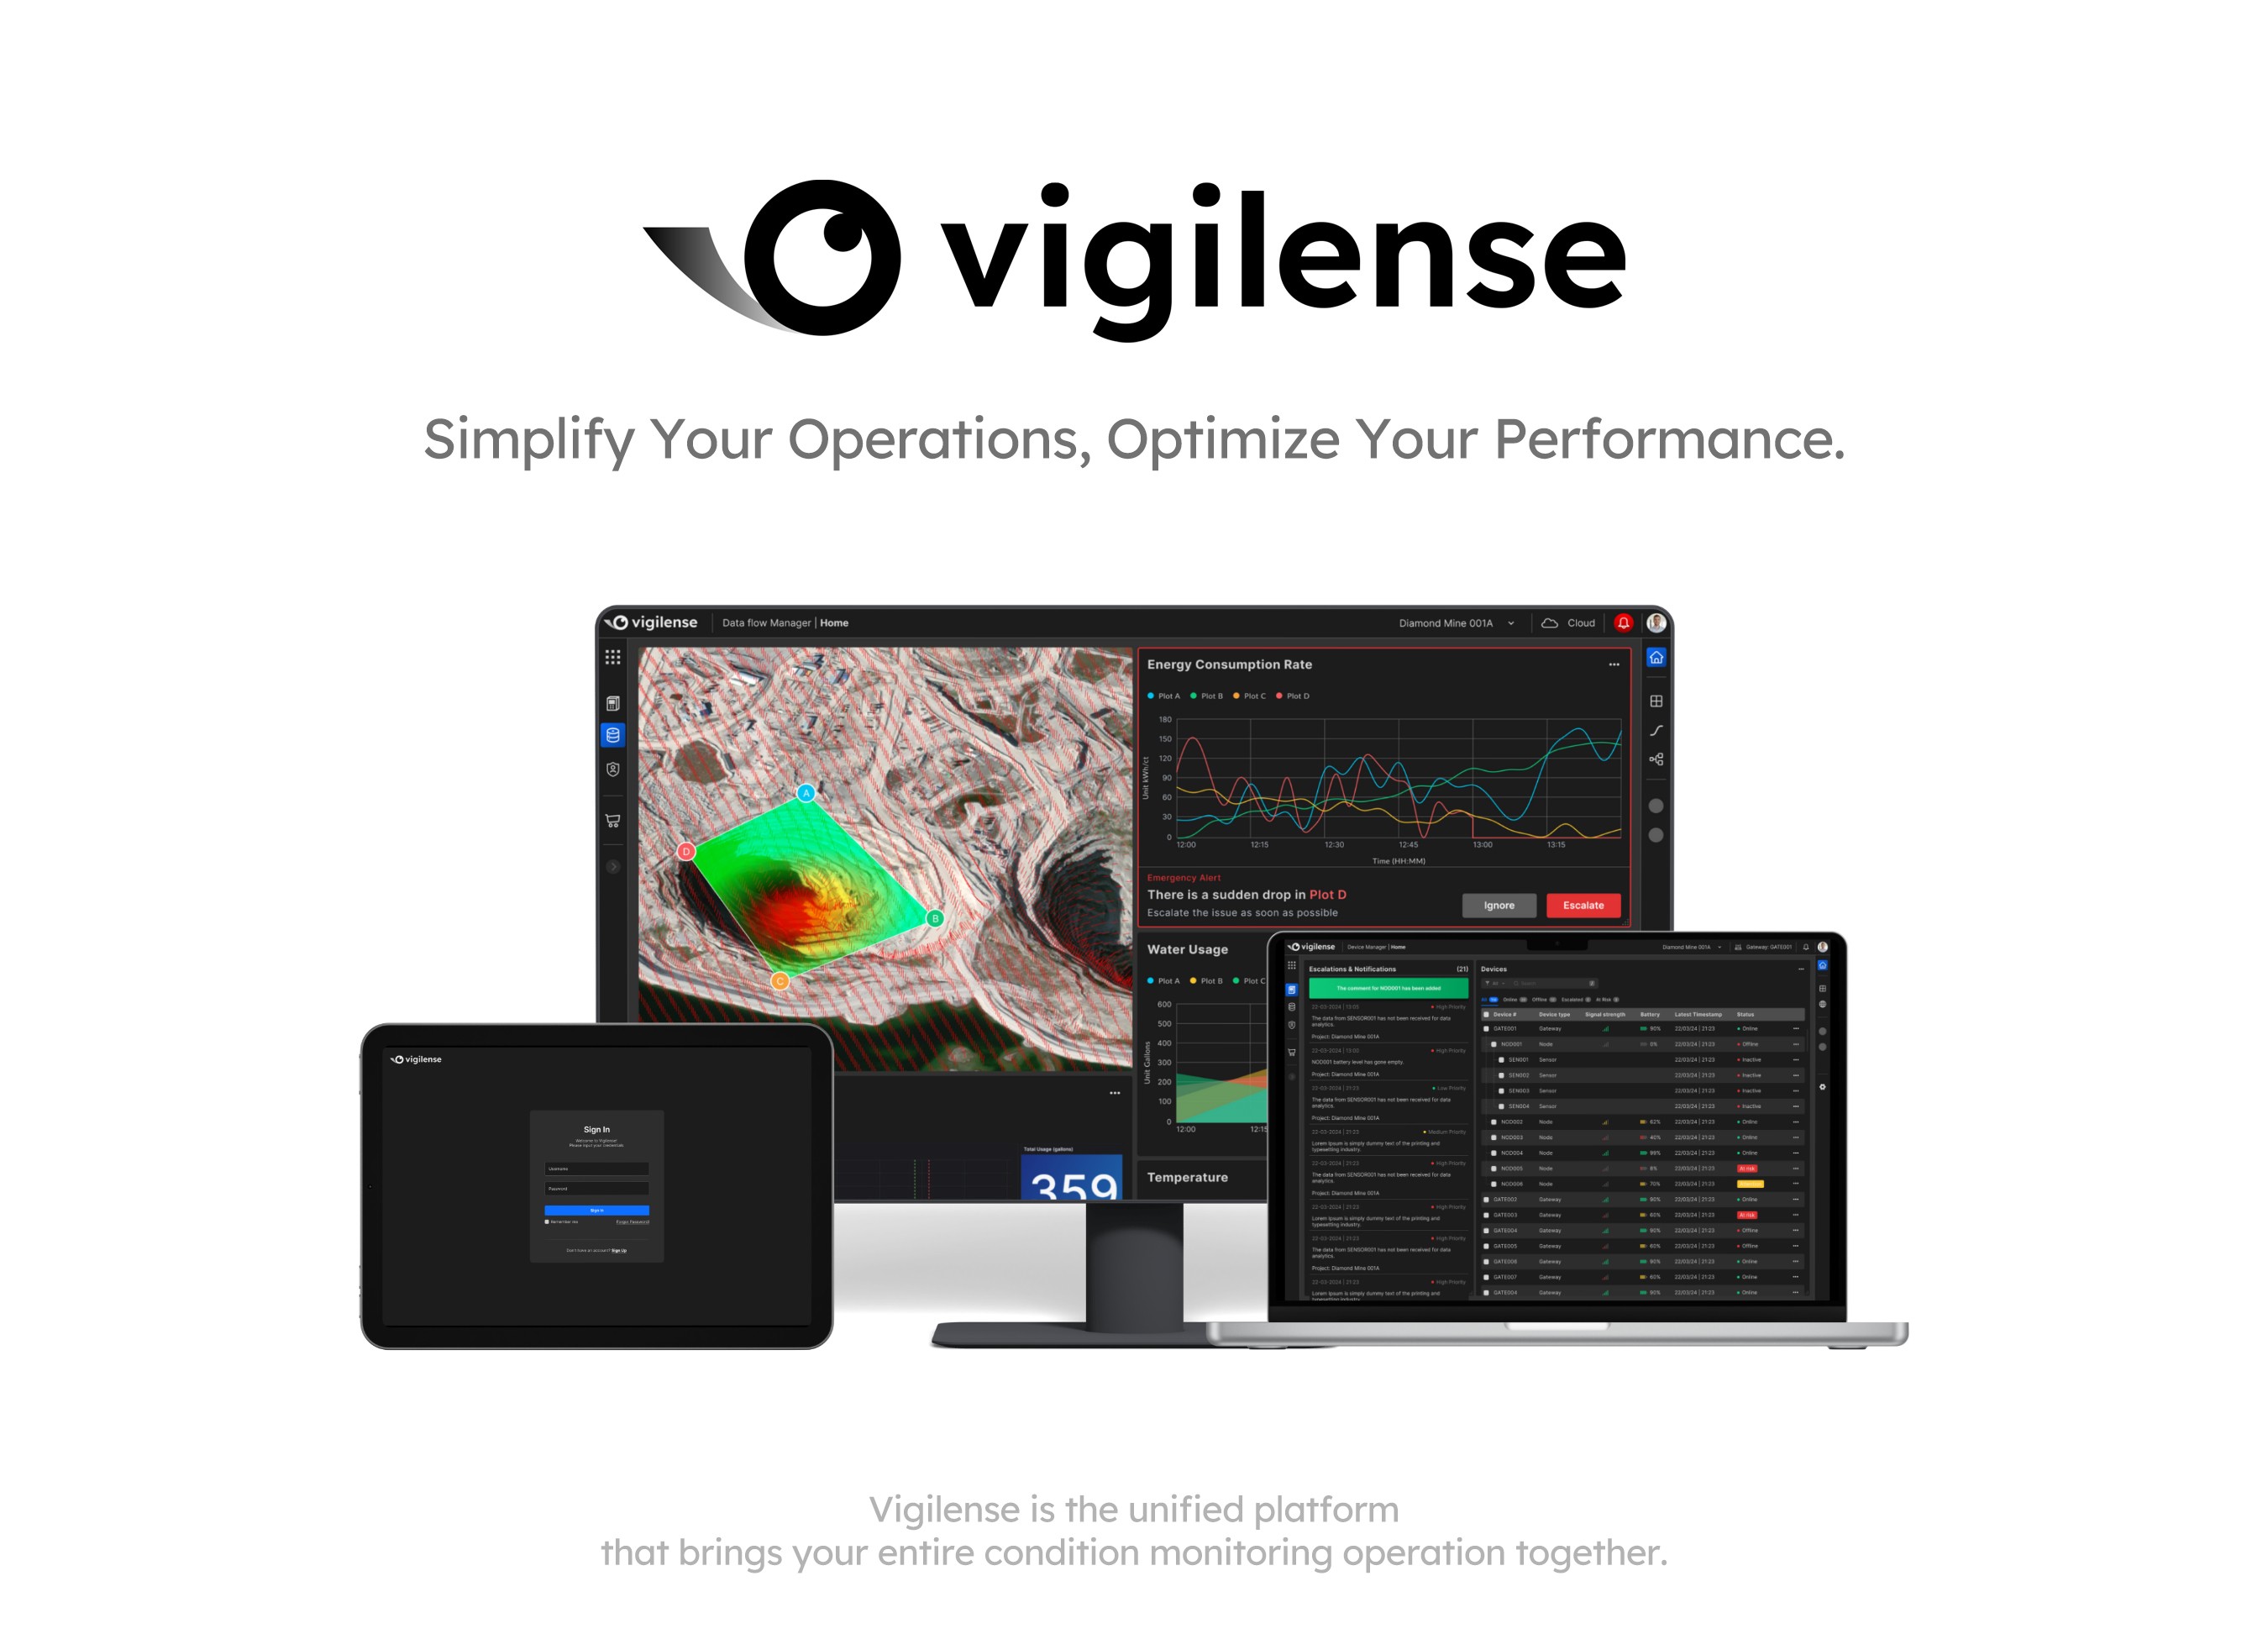
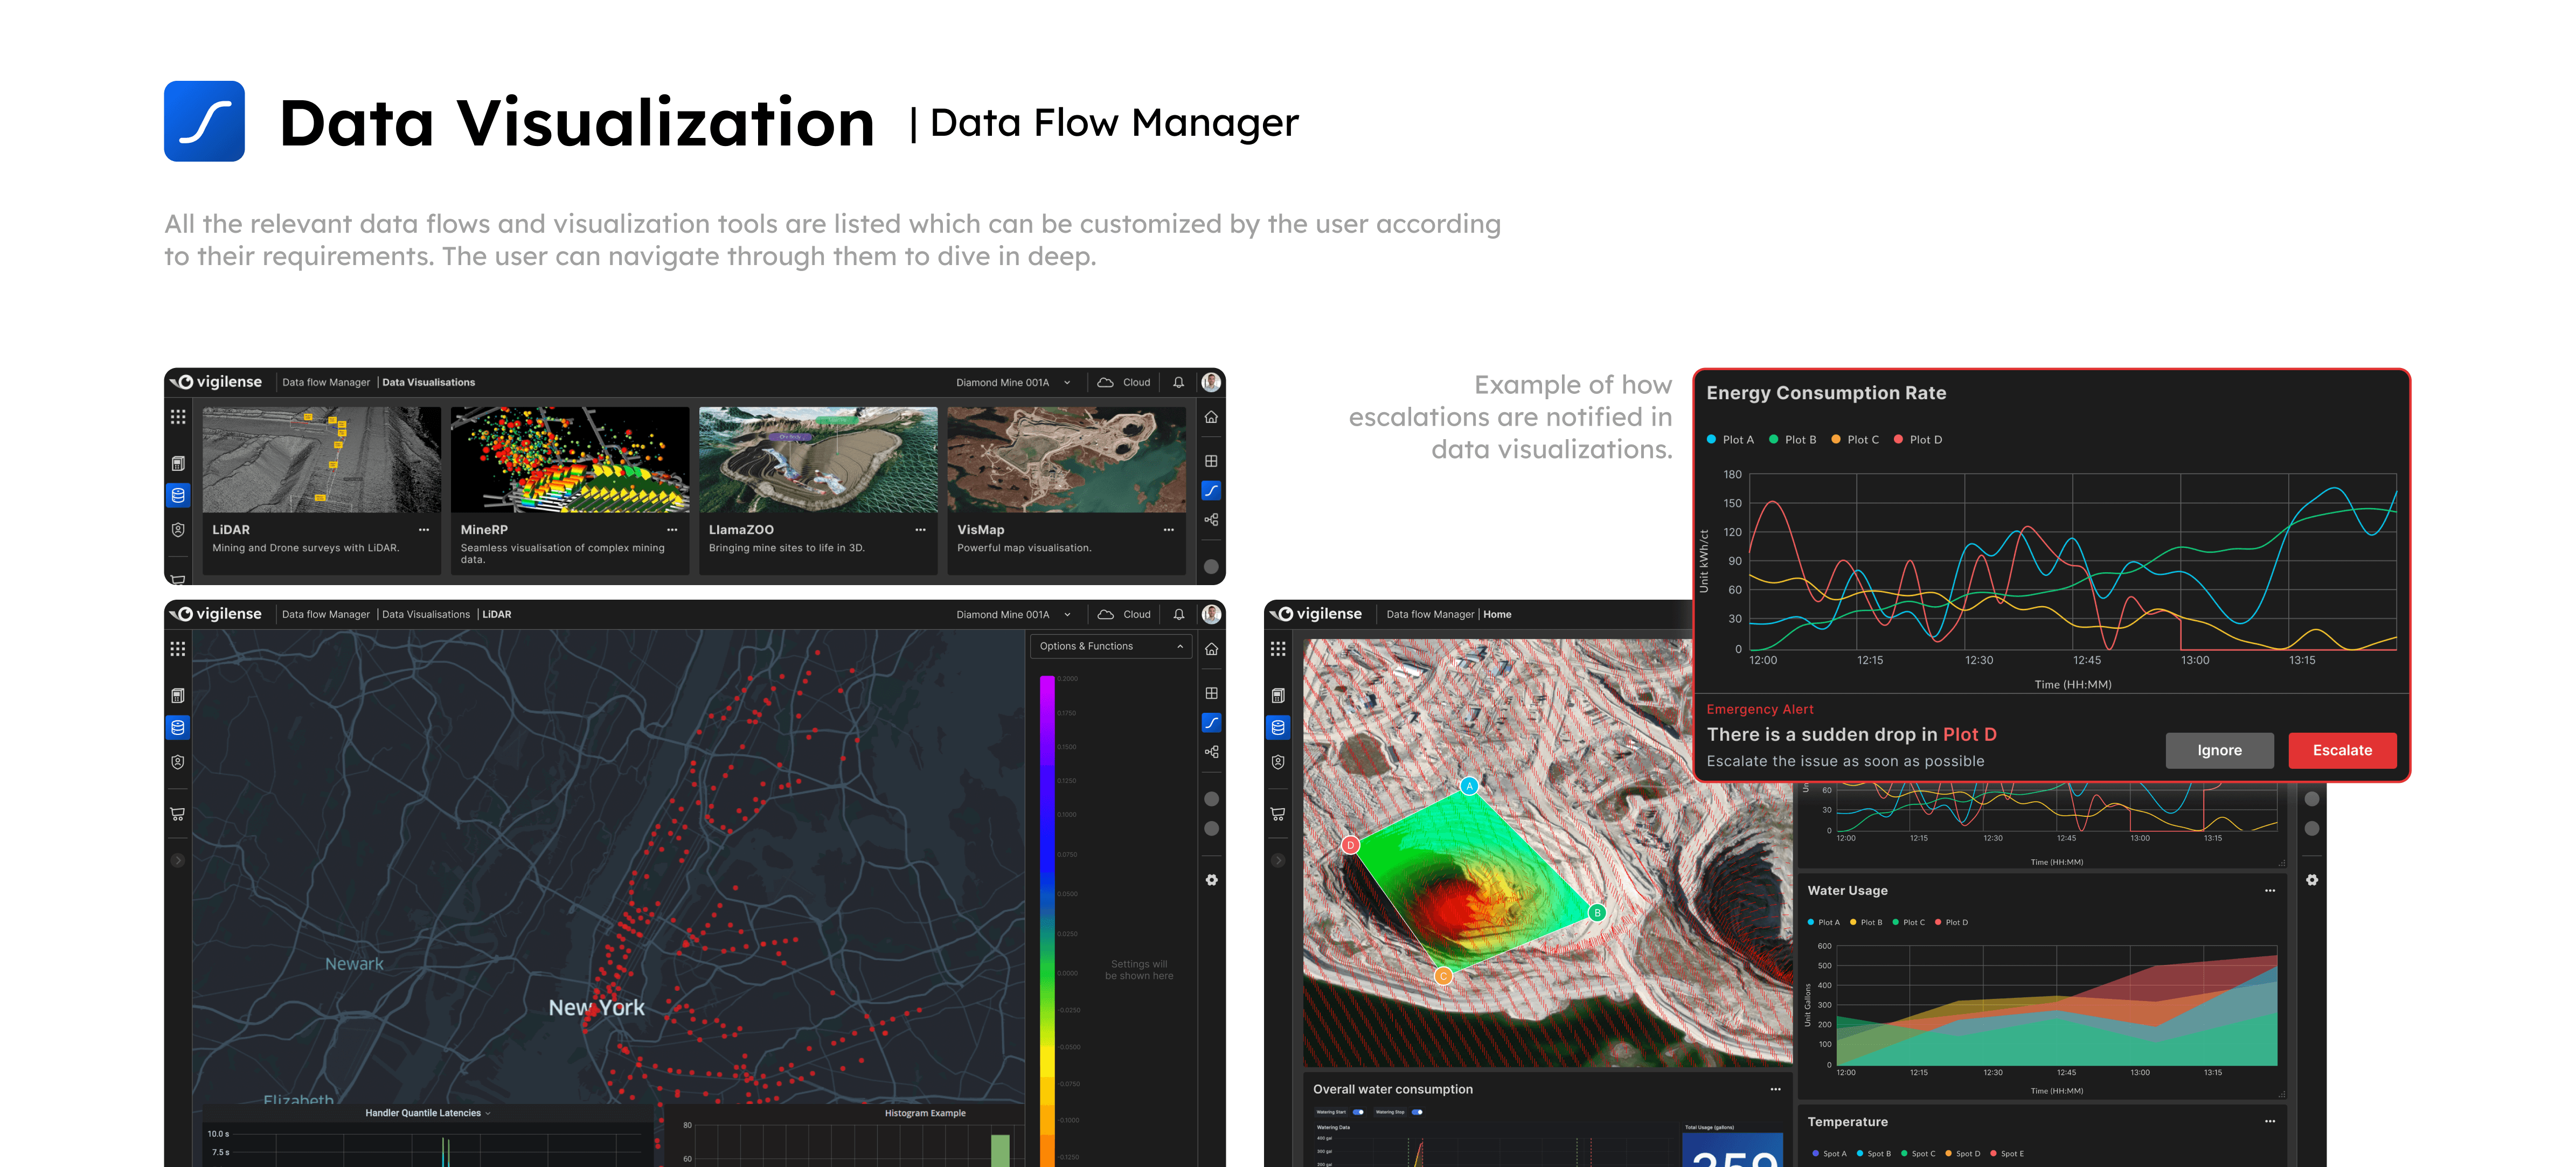
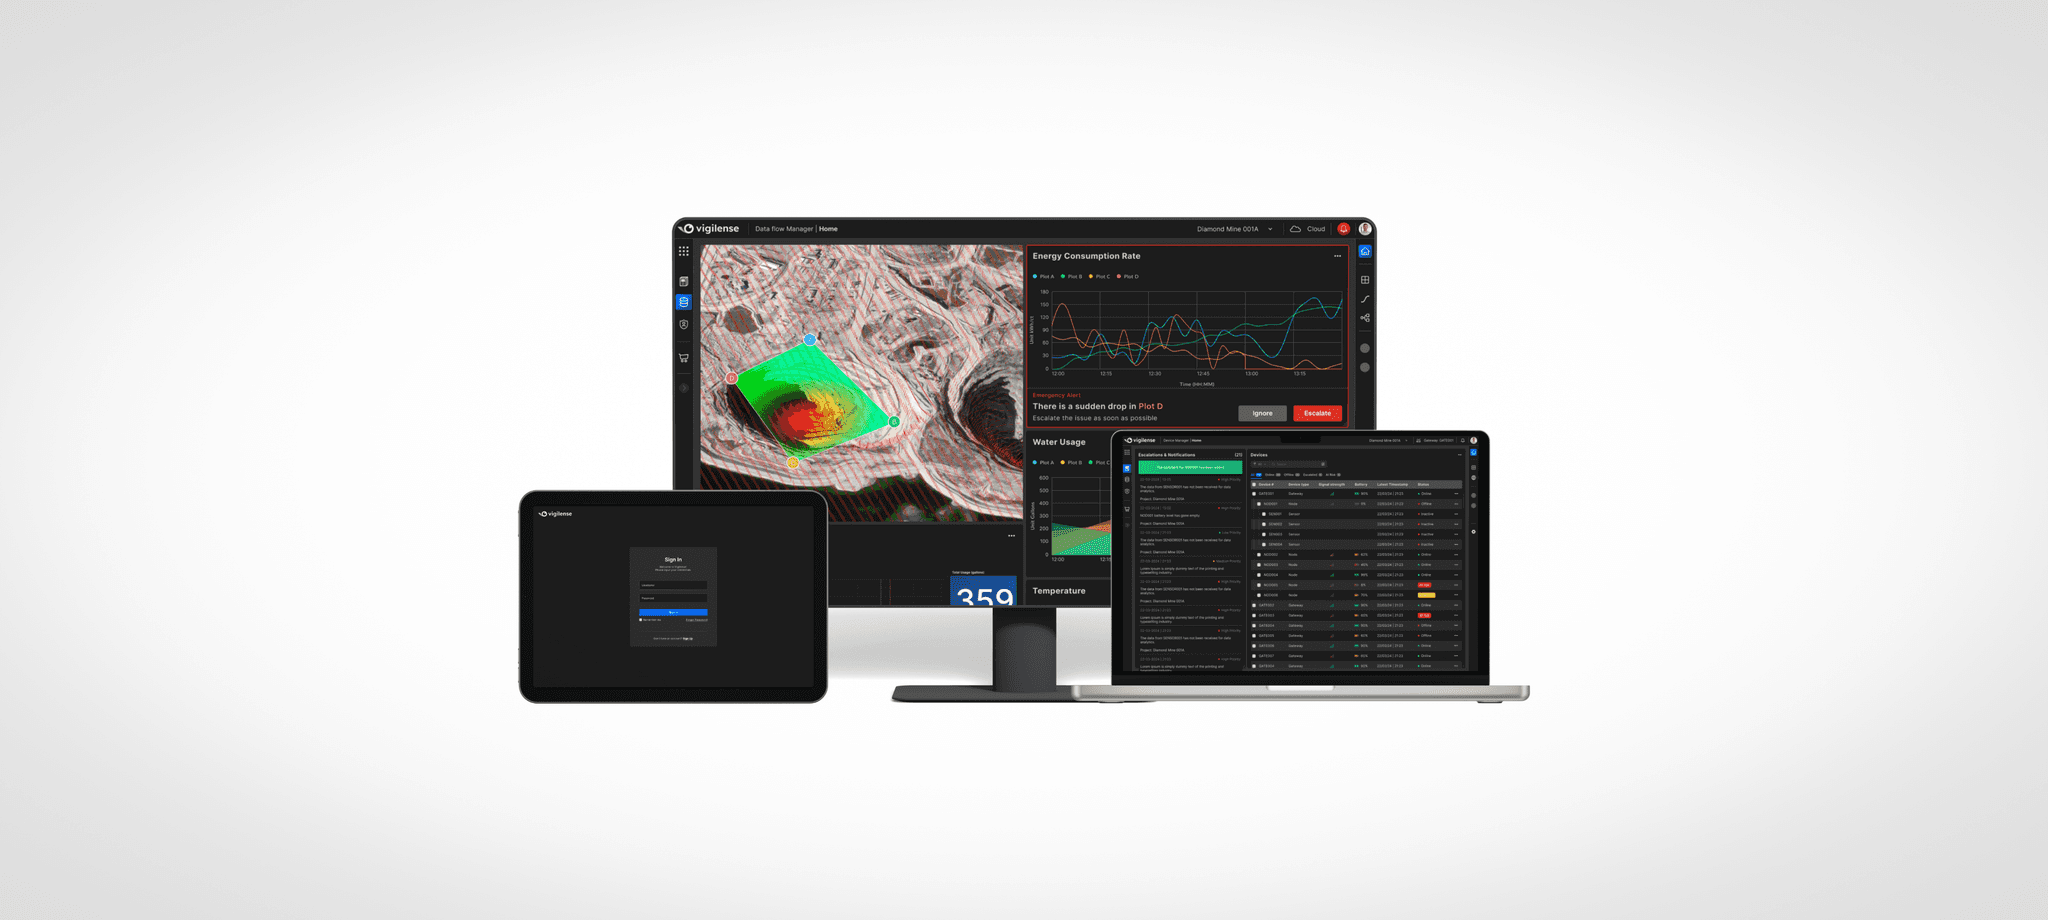
Vigilense is a comprehensive condition monitoring platform designed to streamline operations in Geotechnical Monitoring Industry. By consolidating disparate data sources into a unified interface, Vigilense eliminates the need for users to navigate multiple programs. Advanced data visualisation and analytics capabilities offer in-depth insights, while customizable dashboards and a flexible tool marketplace ensure tailored solutions for diverse user roles and preferences.
As part of my academics in the Interactive Media Management course in Centennial College, I developed this project as my capstone project.
PROBLEM
Industrial facilities such as geotechnical and infrastructural sites increasingly rely on complex Industrial Internet of Things (IIoT) systems to monitor the health and performance of their equipment. However, the current generation of these systems suffers from a fragmented user experience. Separate, complex tools are required for different teams (technicians, engineers, analysts) leading to inefficiencies. These inefficiencies include:
Long learning curves
Difficulty in using the systems.
Multiple Programs
Wasted time spent switching between programs.
Inefficient Communication
Between teams due to disparate data presentations.
Information Overload
Difficulty in identifying critical data points.
These issues ultimately hinder the effectiveness of condition monitoring efforts and lead to unnecessary costs.
Hence the problem definition was defined as:
“How might we implement a unified condition monitoring platform that integrates real-time data visualisation, seamless communication, and device management functionalities, with an intuitive interface that minimises learning curve, to ensure efficient collaboration, rapid response to critical situations, and improved situational awareness for Condition Monitoring?”
SOLUTION
This project proposes the development of a new condition monitoring platform that addresses the shortcomings of existing systems. The core focus of the platform is to improve user experience and cost-effectiveness. The key features that will achieve this goal include:
Unified User Interface
A single, intuitive interface will streamline all aspects of condition monitoring, from data visualisation to managing maintenance tasks.
Role-Based Dashboard
Tailored dashboards will present information targeted to the specific needs of each user group (technicians, analysts, maintenance teams, management). This will ensure everyone has the information they need in a format that is easy to understand and act upon.
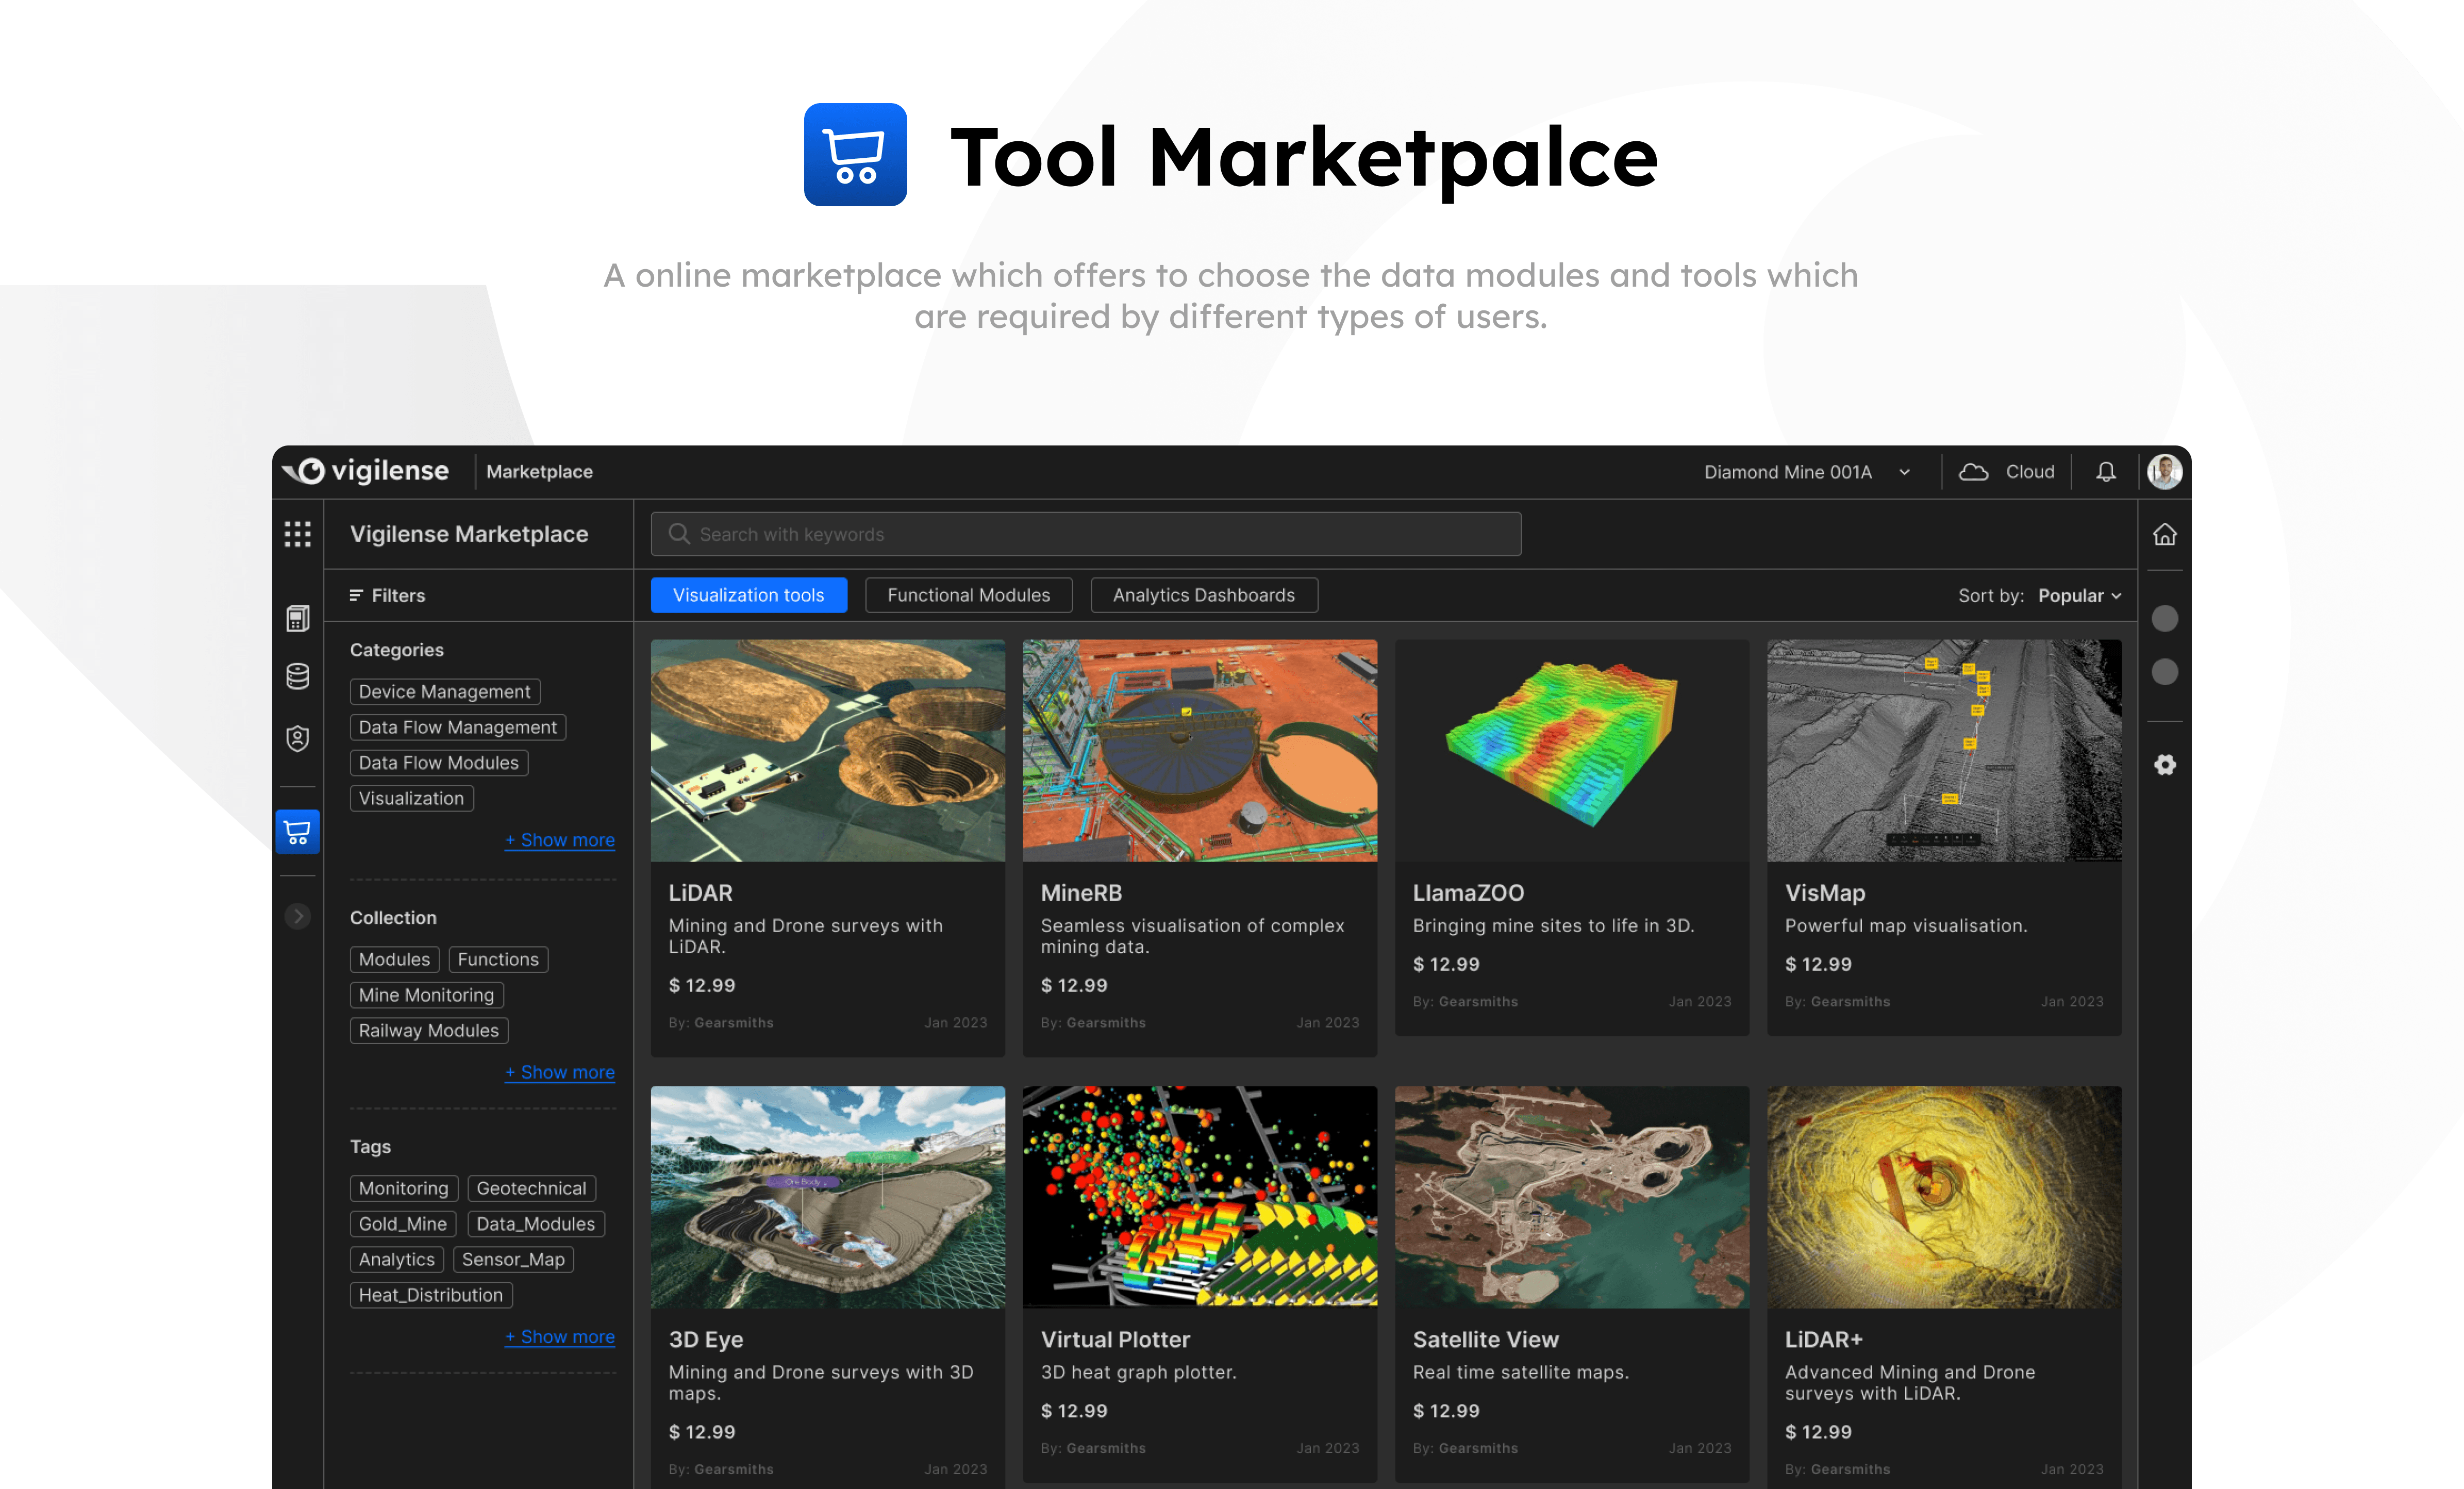
Modular Tool Marketplace
A marketplace will allow users to select and purchase only the tools relevant to their specific industry needs. This will eliminate data overload and keep costs under control.
Enhanced UX
Cloud connectivity and wireless access will enable remote access and configuration of all devices within the condition monitoring system. This will improve overall user experience and system flexibility.
RESEARCH
Target Users
Since the Geotechnical Monitoring industry is a closed domain, the people who involve in relevant projects are the target users. The following are the most possible set of user categories.
Technicians
Responsible for installing, maintaining, and calibrating the devices in the sites or infrastructures. They ensure accurate data collection for effective monitoring.
Data Analysts & Engineers
Design and manage the data collection, storage, and transmission infrastructure. They ensure smooth data flow and might also be involved in developing initial data visualisation tools.
Condition Monitoring Specialists
Analyse the visualised data (charts, dashboards) to identify trends and potential issues. They might collaborate with data analysts to refine visualisations and utilise their domain knowledge to interpret the data in the context of specific needs.
Maintenance Teams
Once alerts or notifications are triggered, they investigate the issue, perform maintenance, and ensure the smooth operation. There are two types of maintenance teams;
Site/Infrastructure maintenance teams
Device maintenance teams
Management
They leverage the insights from condition monitoring data to make informed decisions about asset management, resource allocation, and budgeting for maintenance activities.
Survey

Personas
John Kerry
Technician
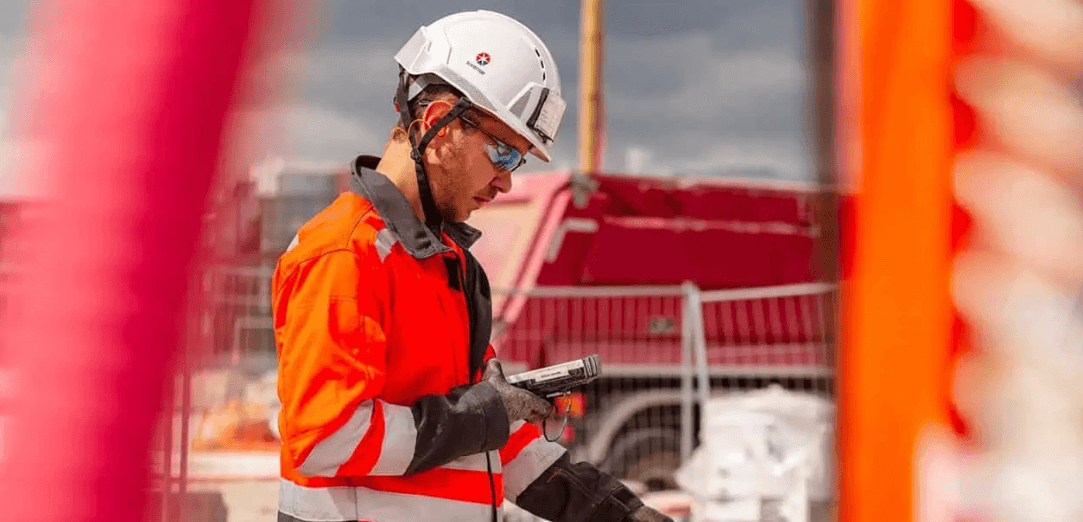
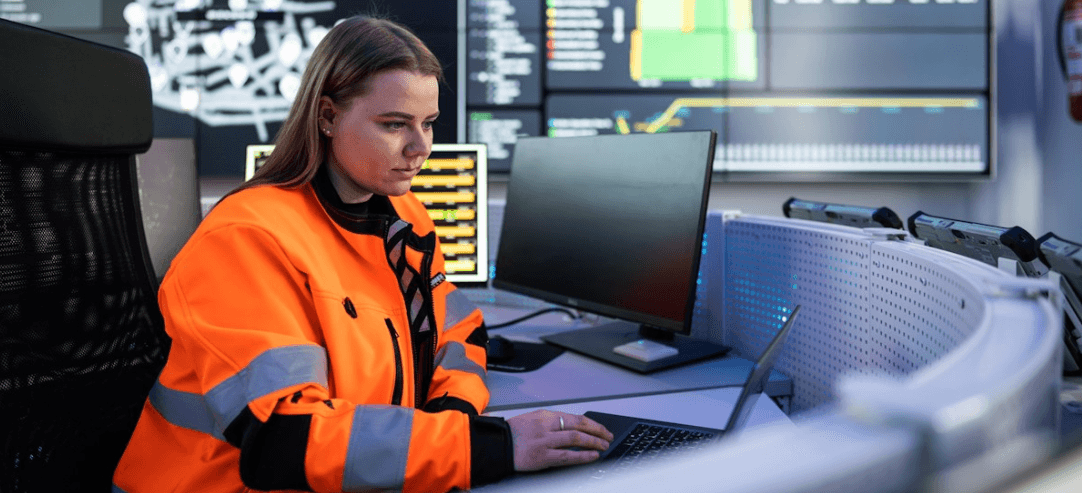
John is a technician who is responsible for setting up and maintaining industrial sensors that monitor infrastructural and geotechnical sites’ structural integrity. John mostly uses an Android app for installation but often faces miscommunication issues with peers and multiple fragmented tools.
Emily Smith
Network Engineer
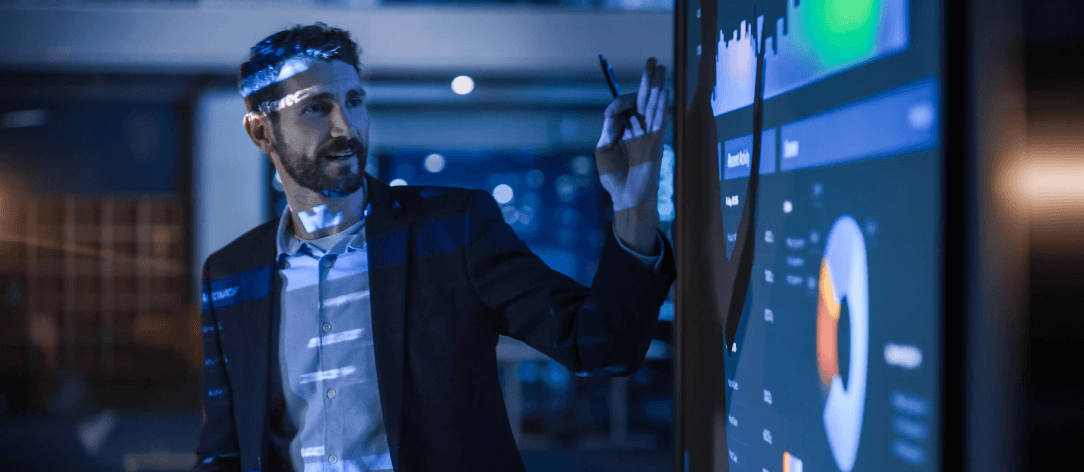
Emily is a network engineer who manages network connections and ensures proper communication between all devices and the central system. She frequently troubleshoots network issues and ensures data flows seamlessly across the platform.
Alex Johnson
Data Analyst
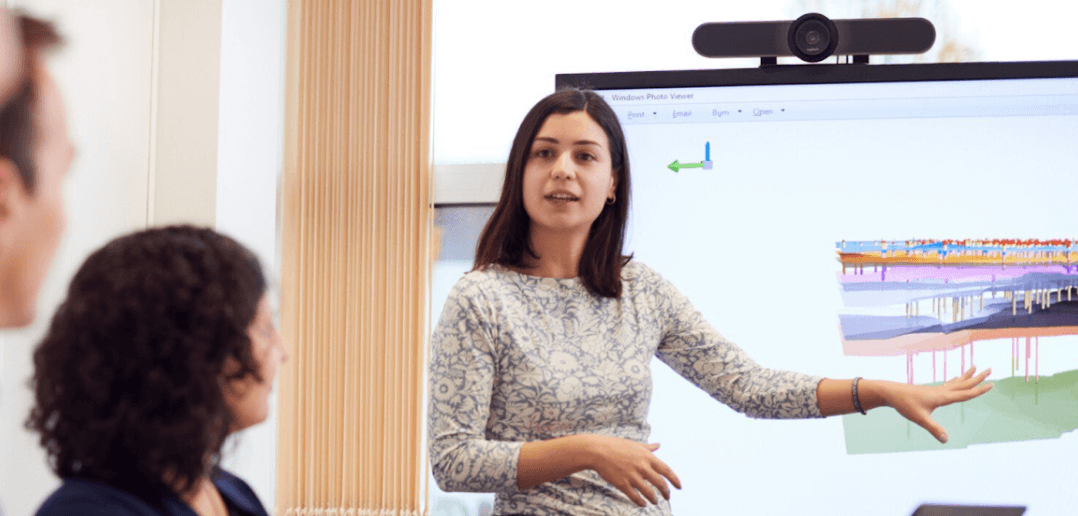
Alex is a data scientist specializing in analyzing data from industrial sensors. He uses various data visualization tools to monitor and report on the condition of infrastructural and geotechnical sites. Alex relies on real-time data and visualizations to identify issues and generate reports for the engineering team.
Sara Williams
Project Manager
Sara is a project manager overseeing condition-monitoring project operations. She coordinates between different teams, ensuring projects are completed on time and within budget. Sara deals with frequent communication issues and project delays and strives to streamline processes to improve overall efficiency.
CONCEPTUALISATION
UX Theme
"A separate application for managing the devices which are connected to the projects."
This theme highlights the project's focus on integrating multiple functionalities into a single platform, ensuring a streamlined and clear user experience. It underscores the importance of efficiency in accessing and interpreting data, as well as the clarity provided through tailored dashboards and intuitive interfaces, making condition monitoring more effective and on to the point.
The three major core functionalities were defined as,
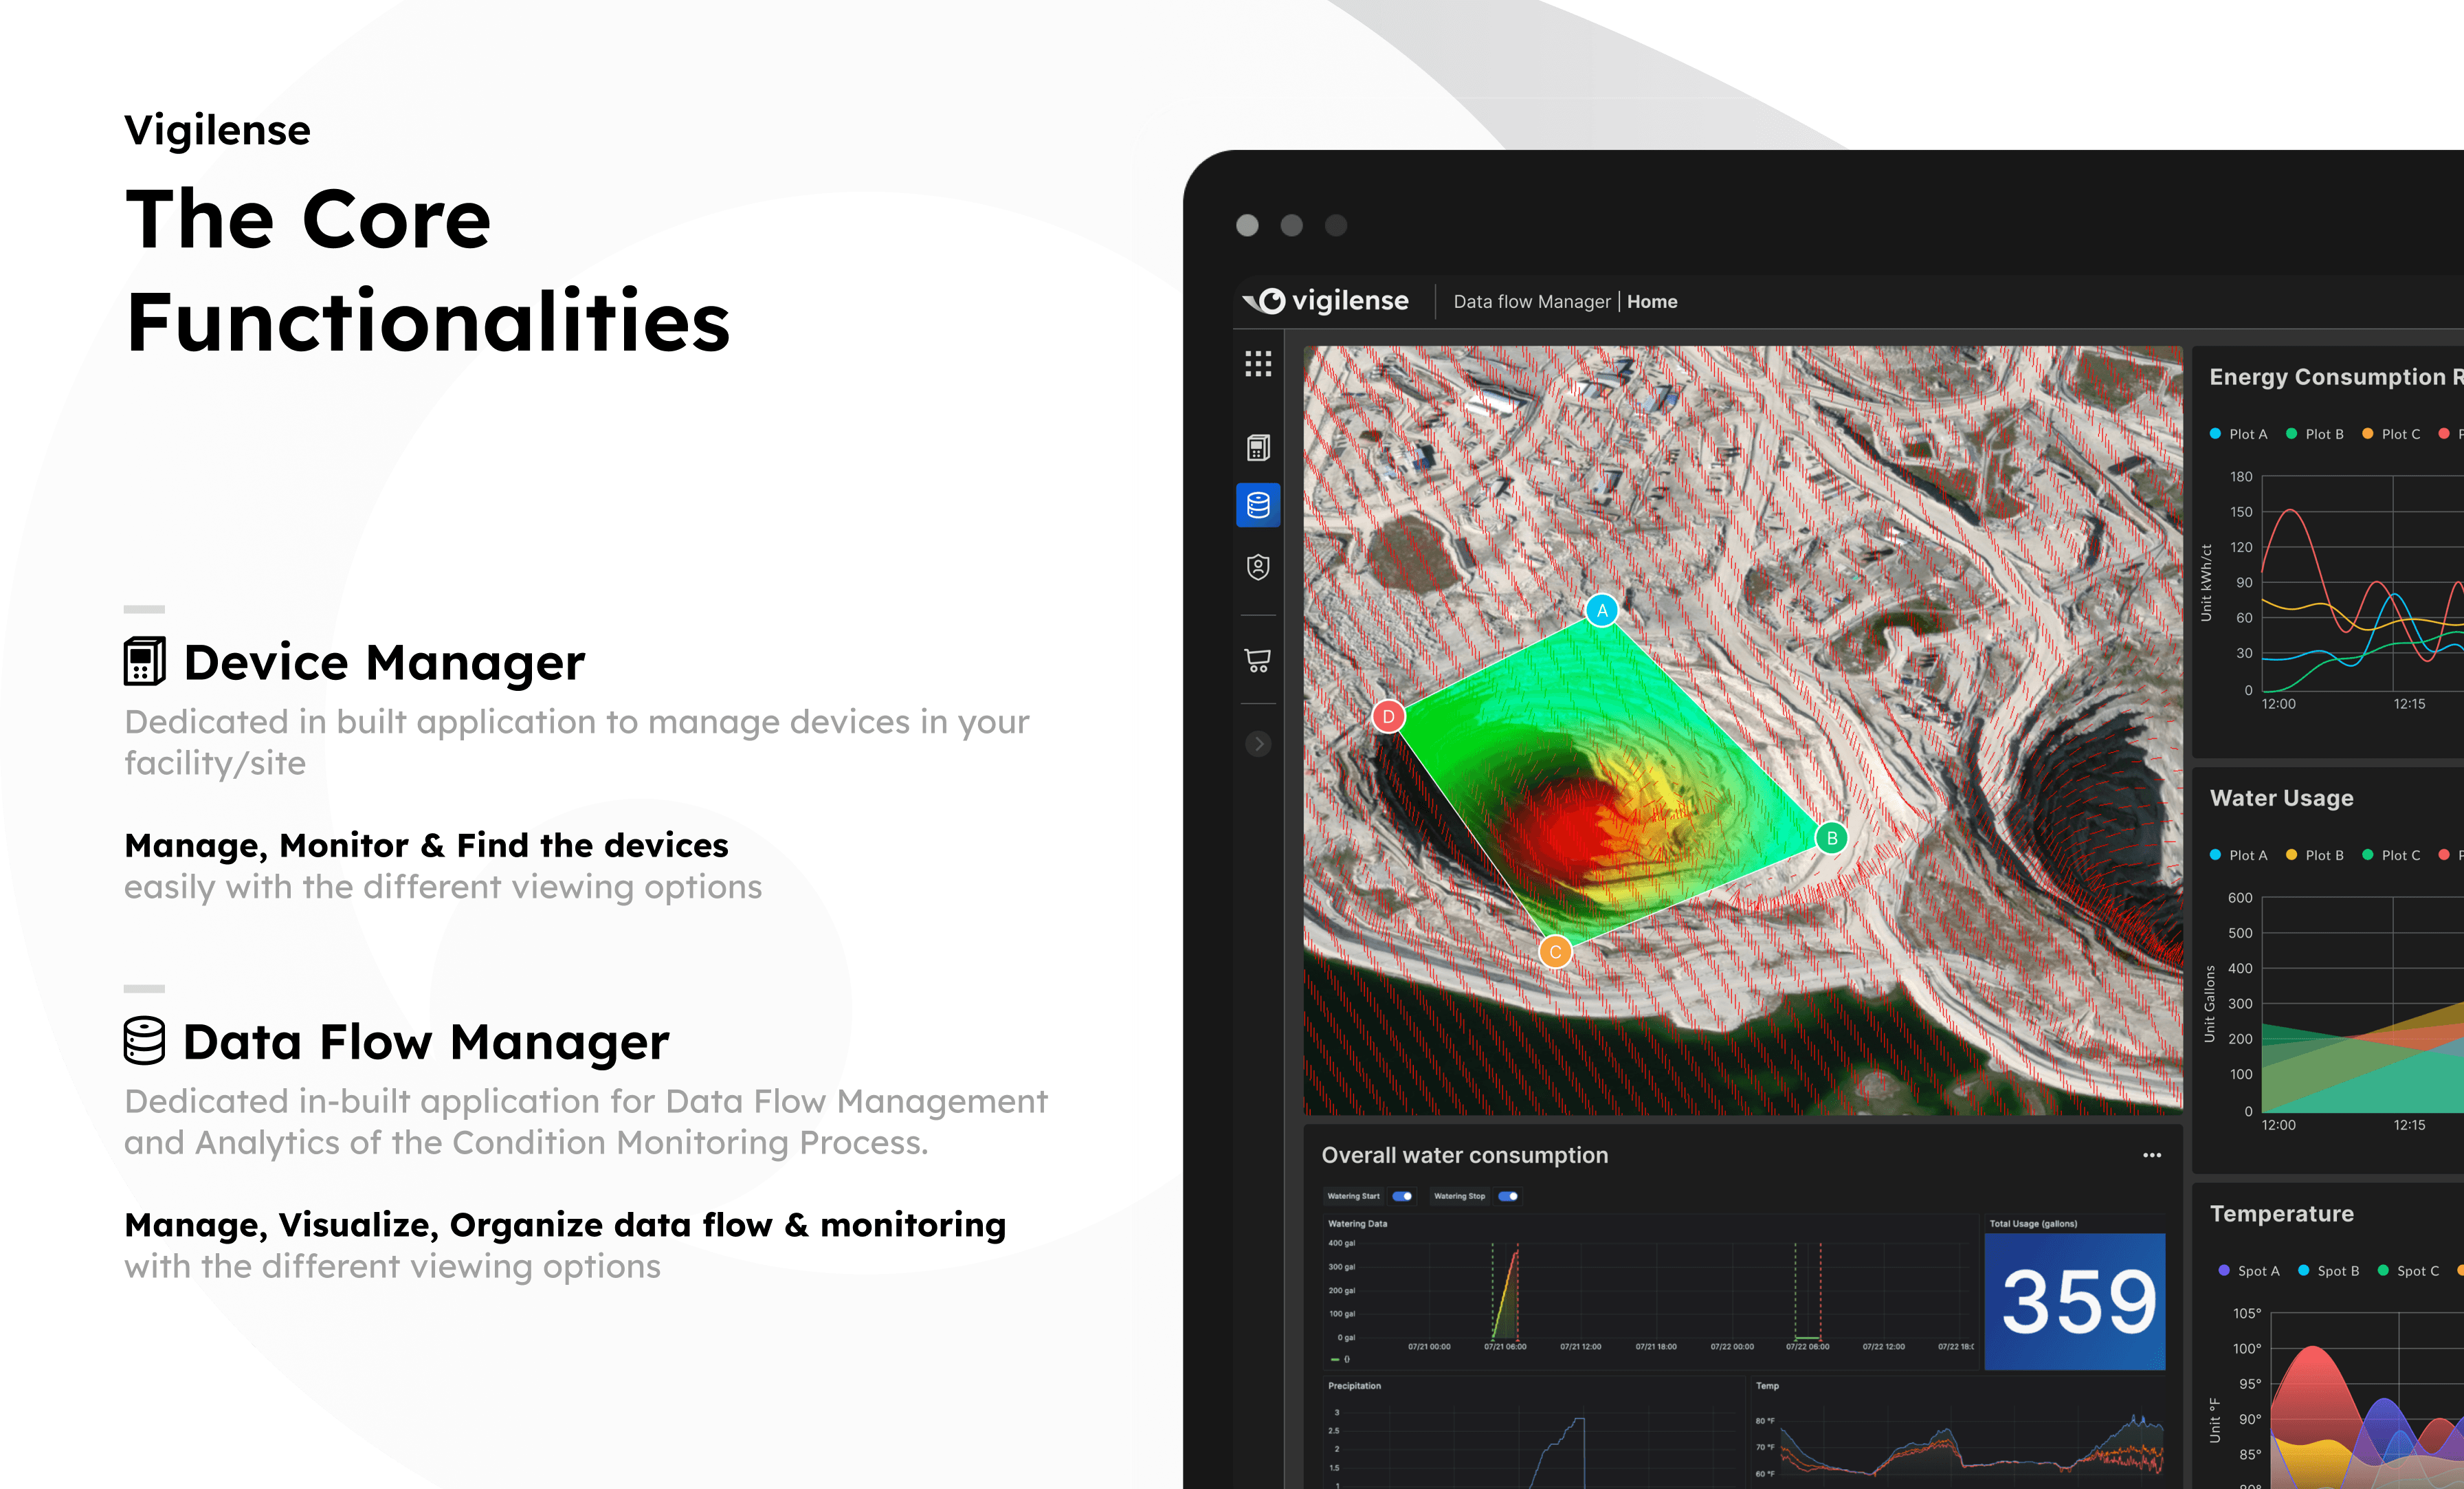
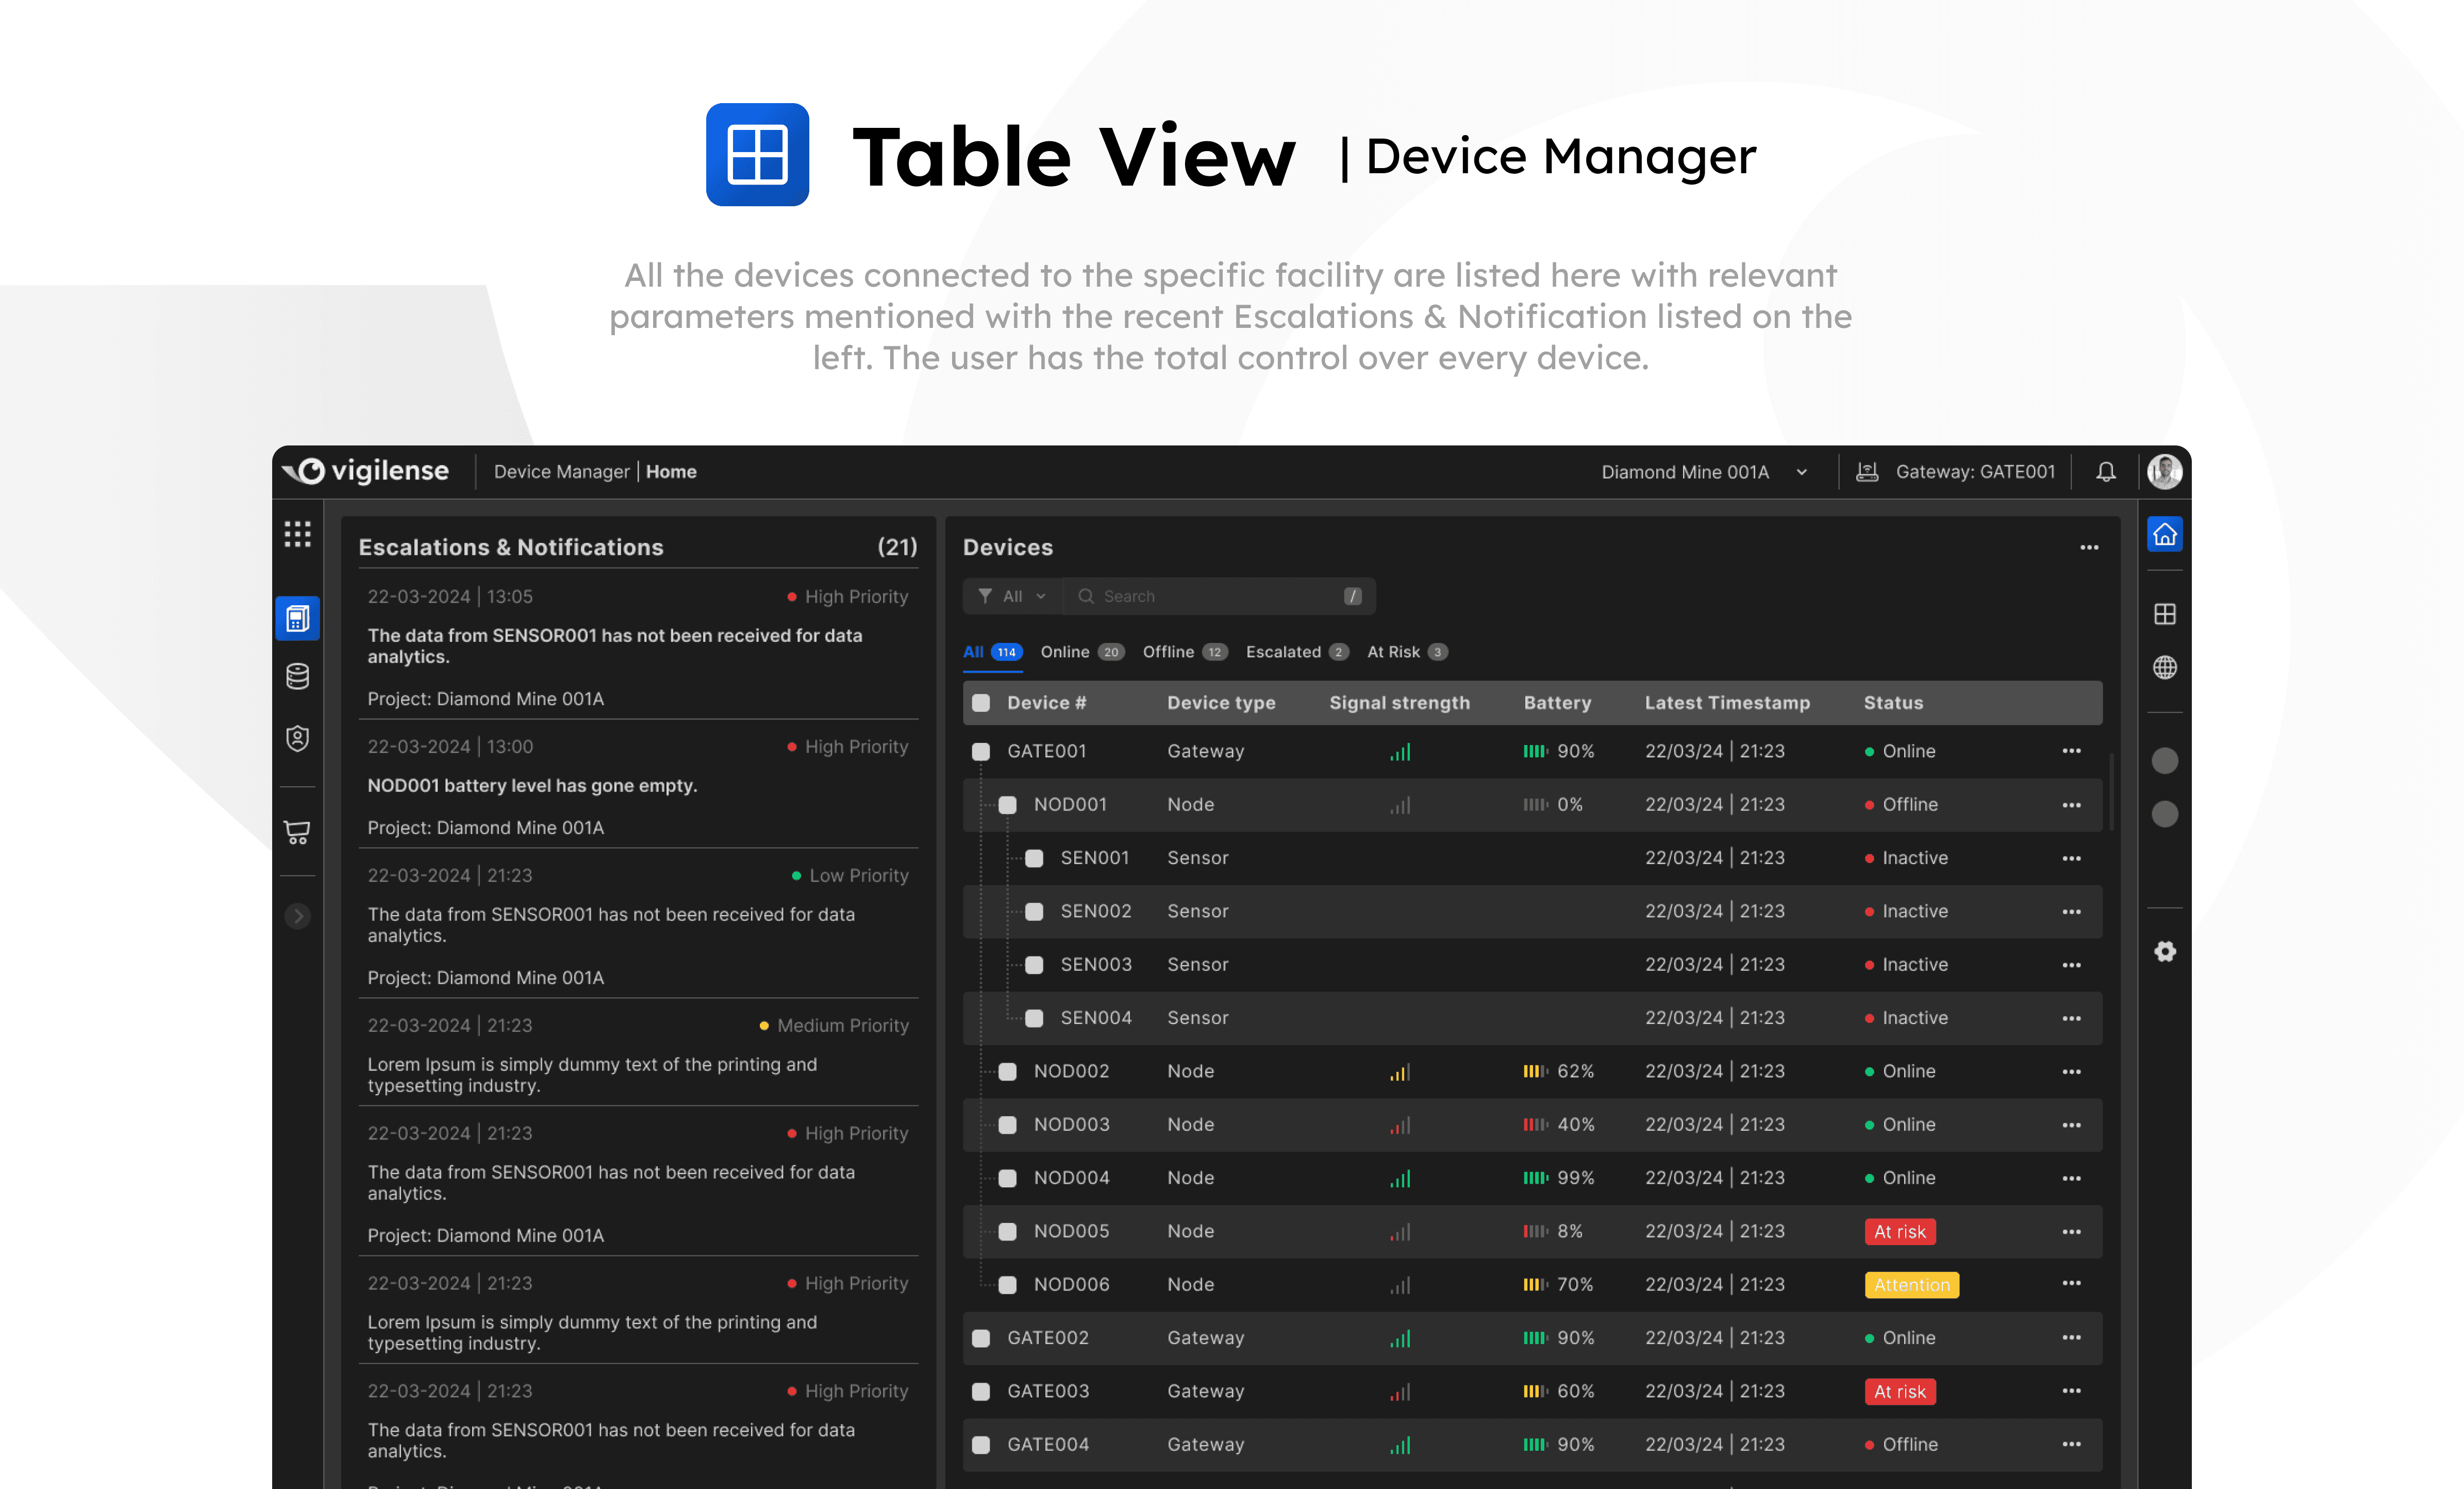
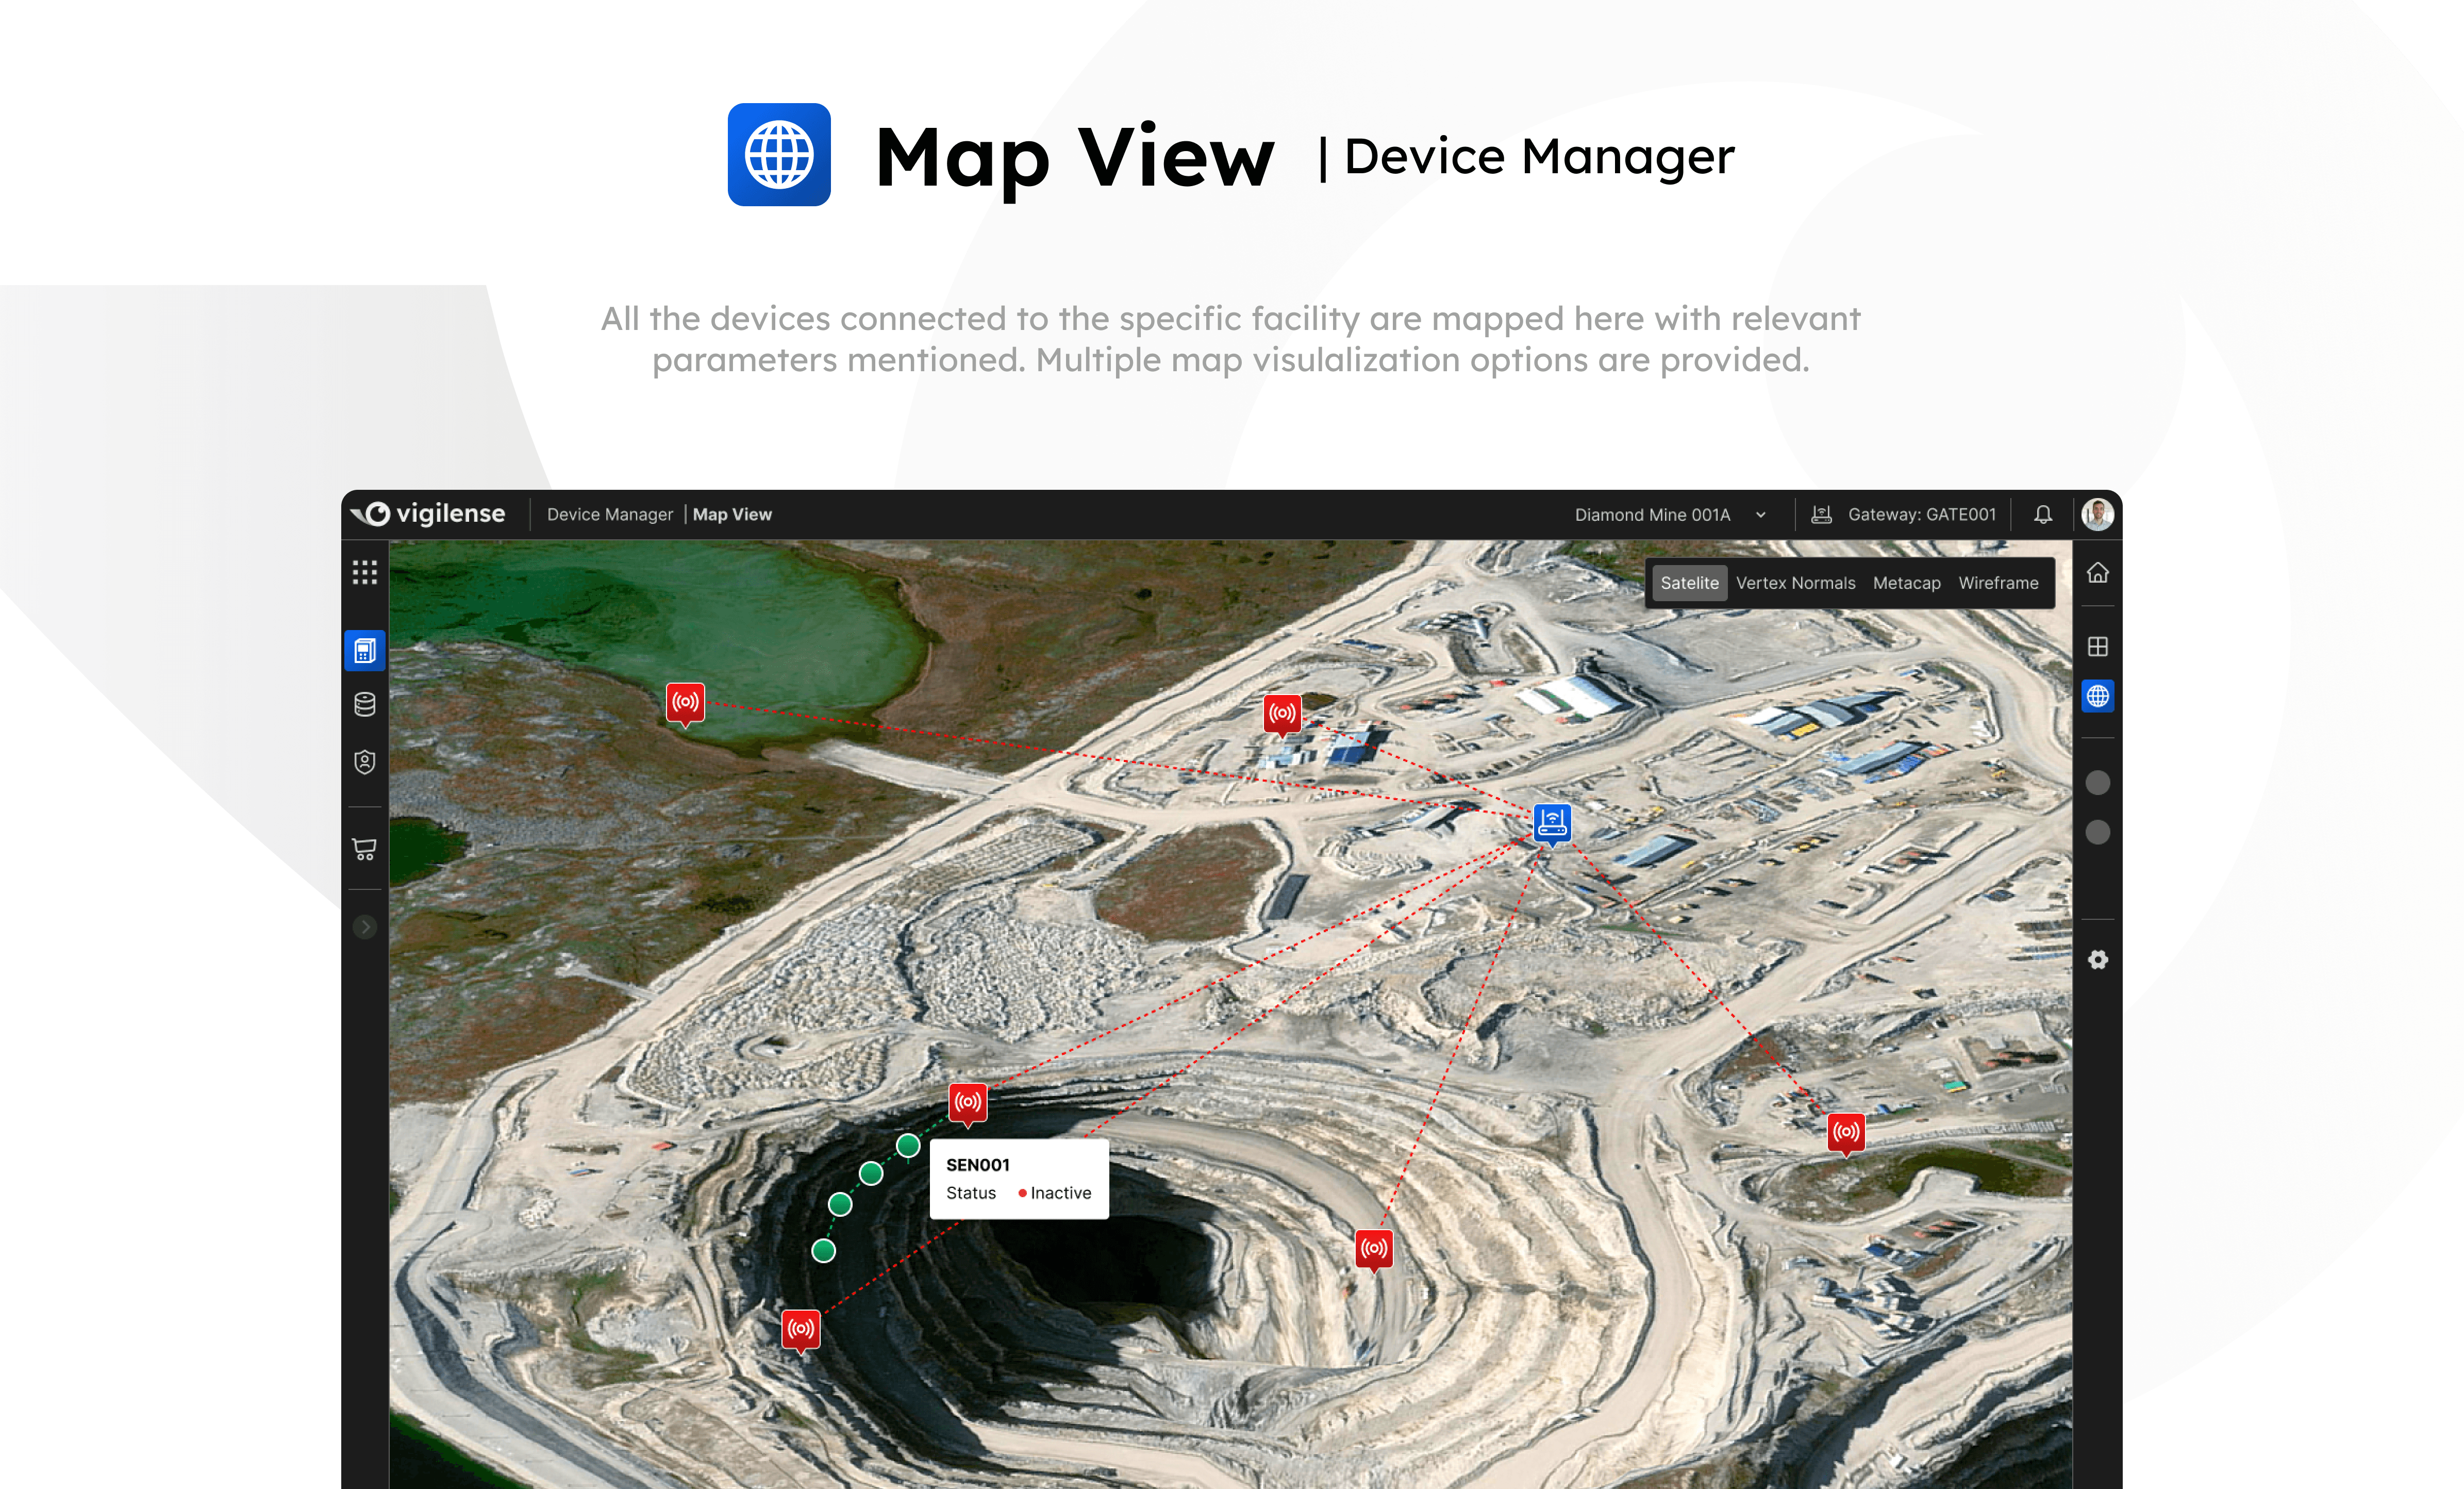
Device Manager
A separate application for managing the devices which are connected to the projects.
Data Flow Manager
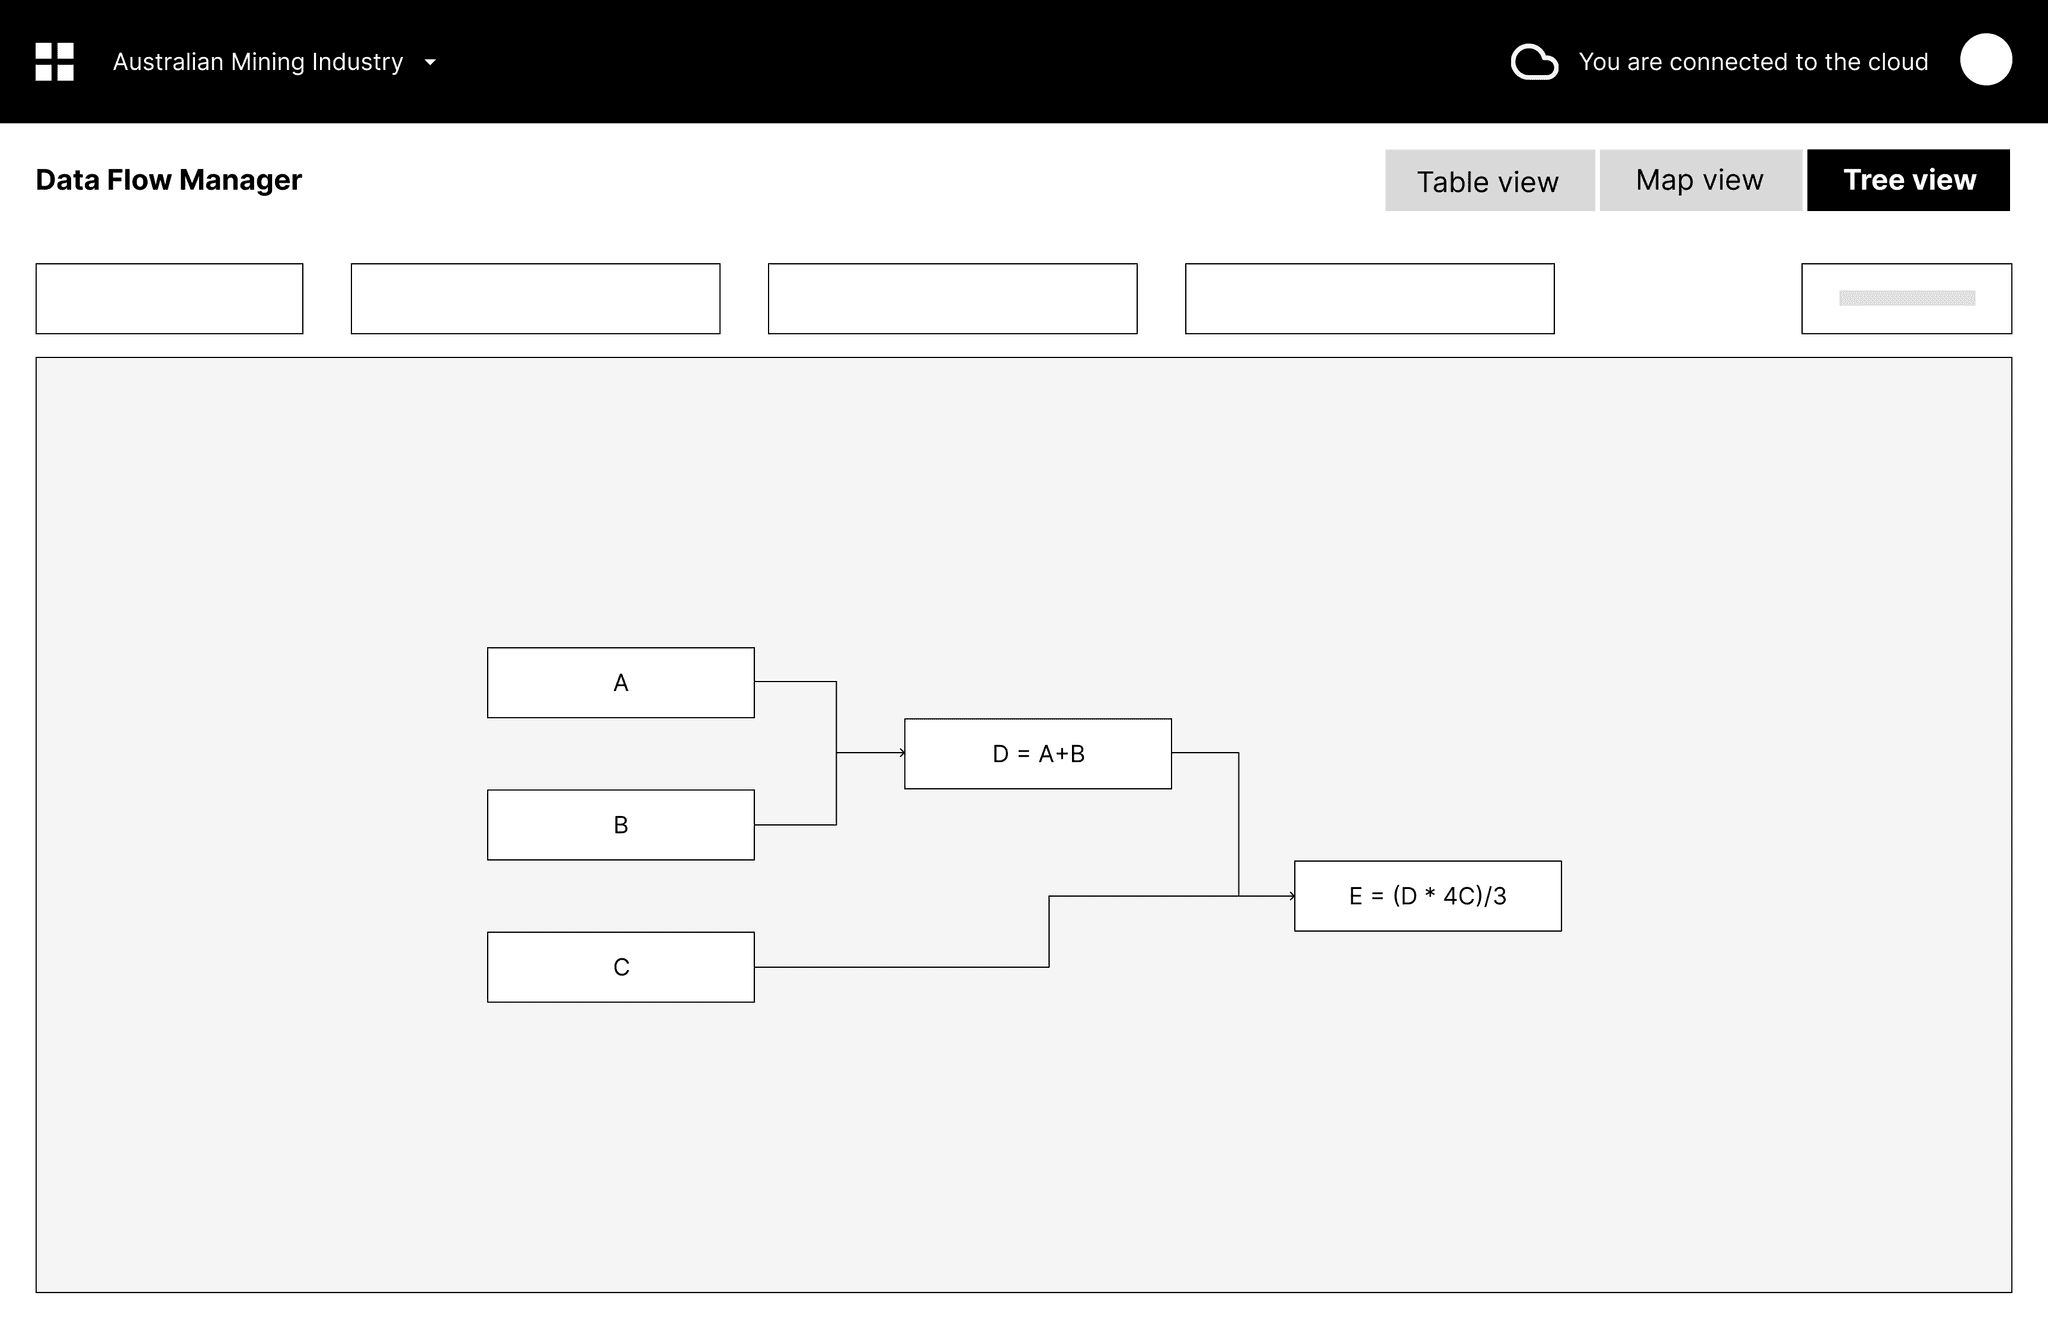
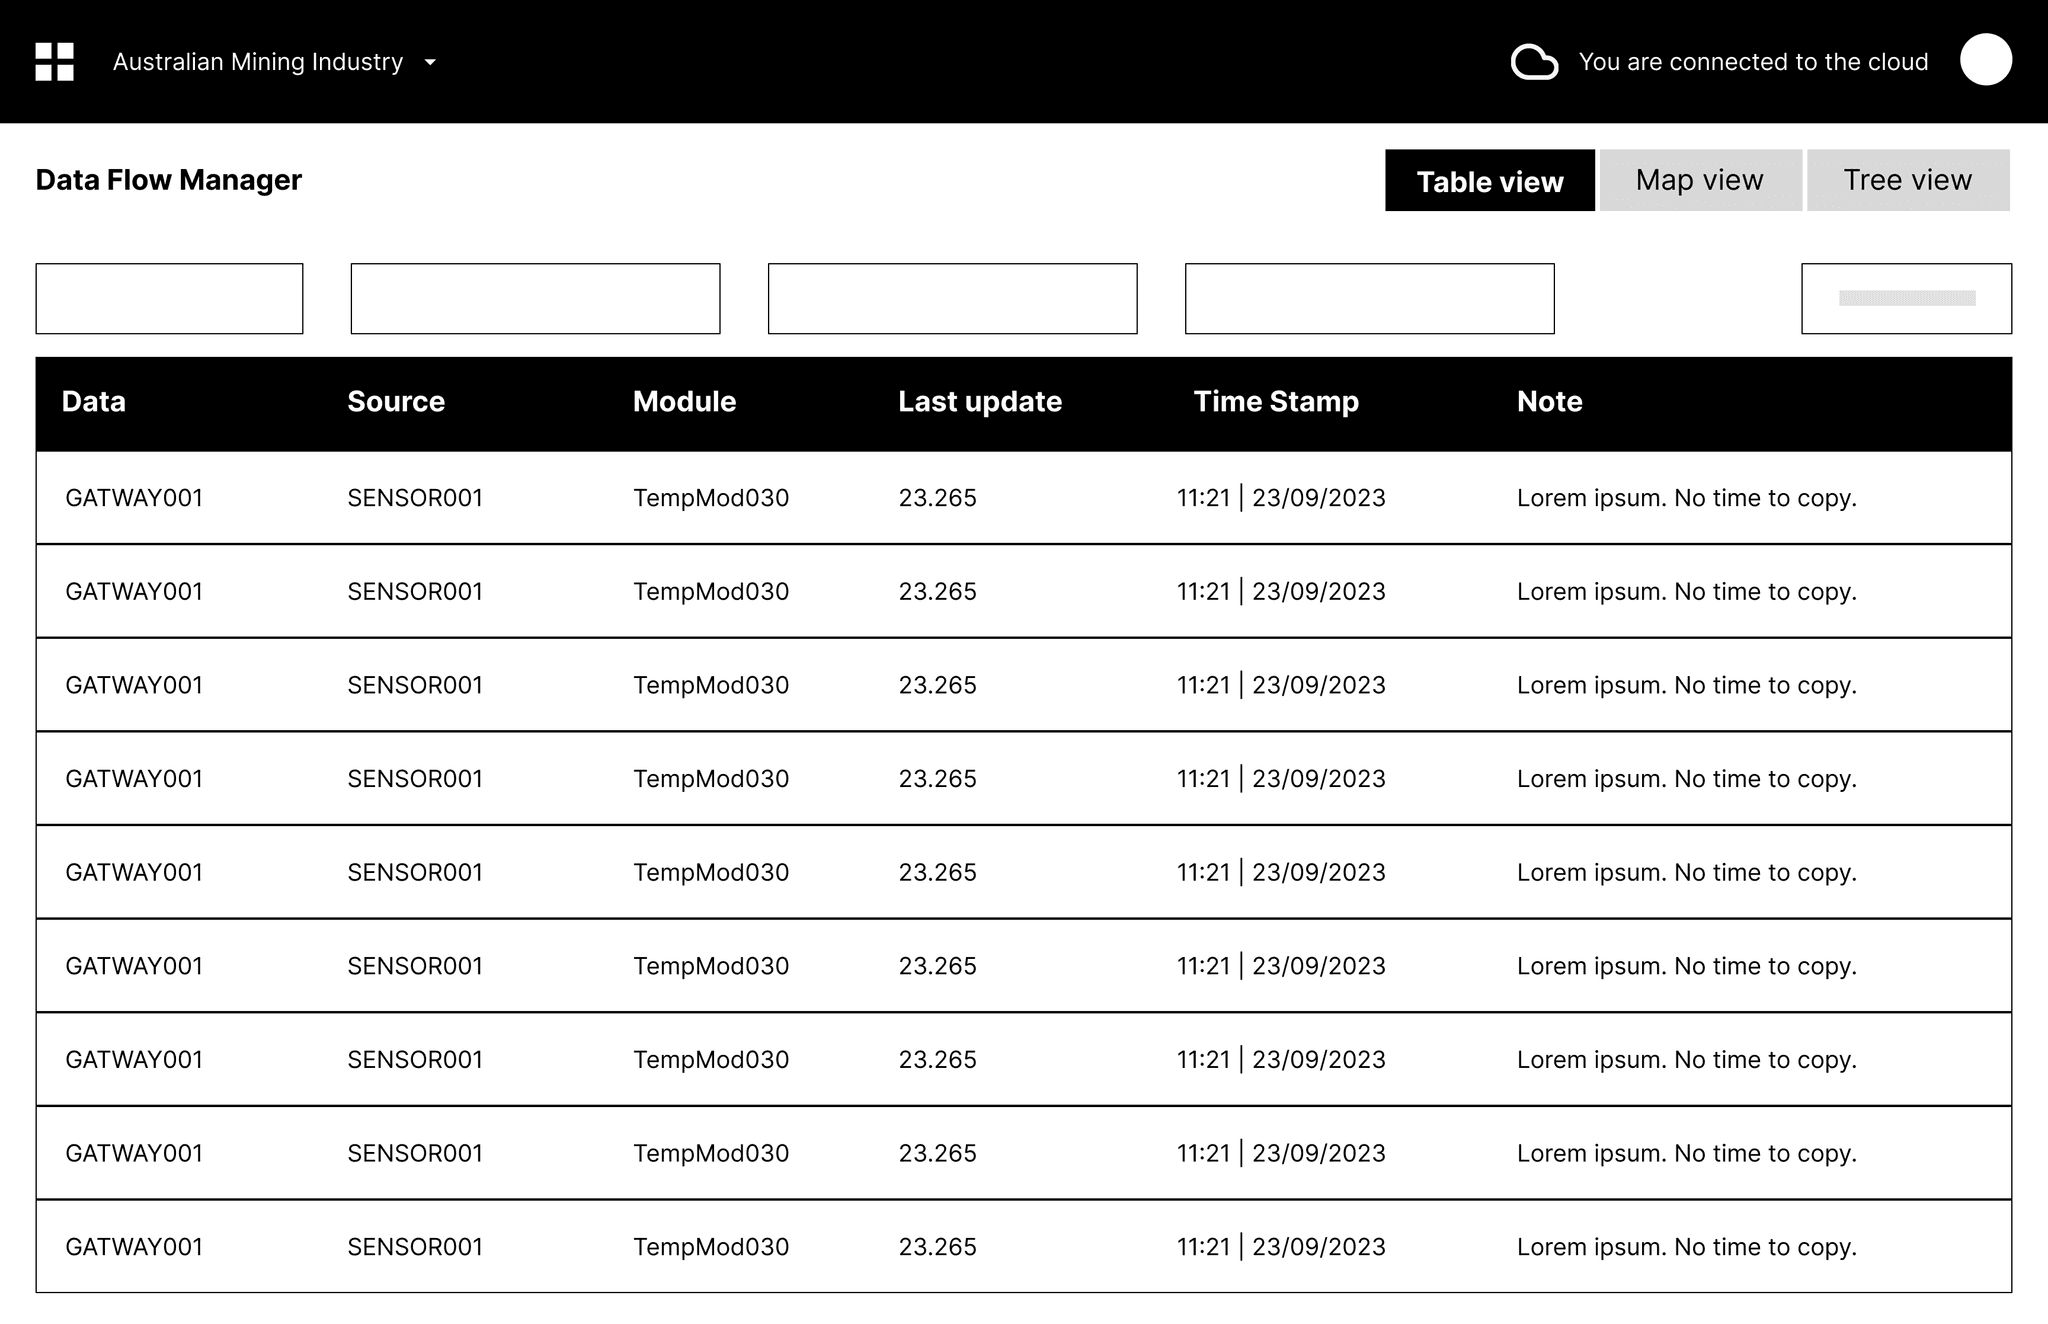
An application to monitor and manage the data flow throughout the projects.
Modular Tool Marketplace
A marketplace which allows users to select and purchase only the tools relevant to their specific needs.
DESIGN PROCESS
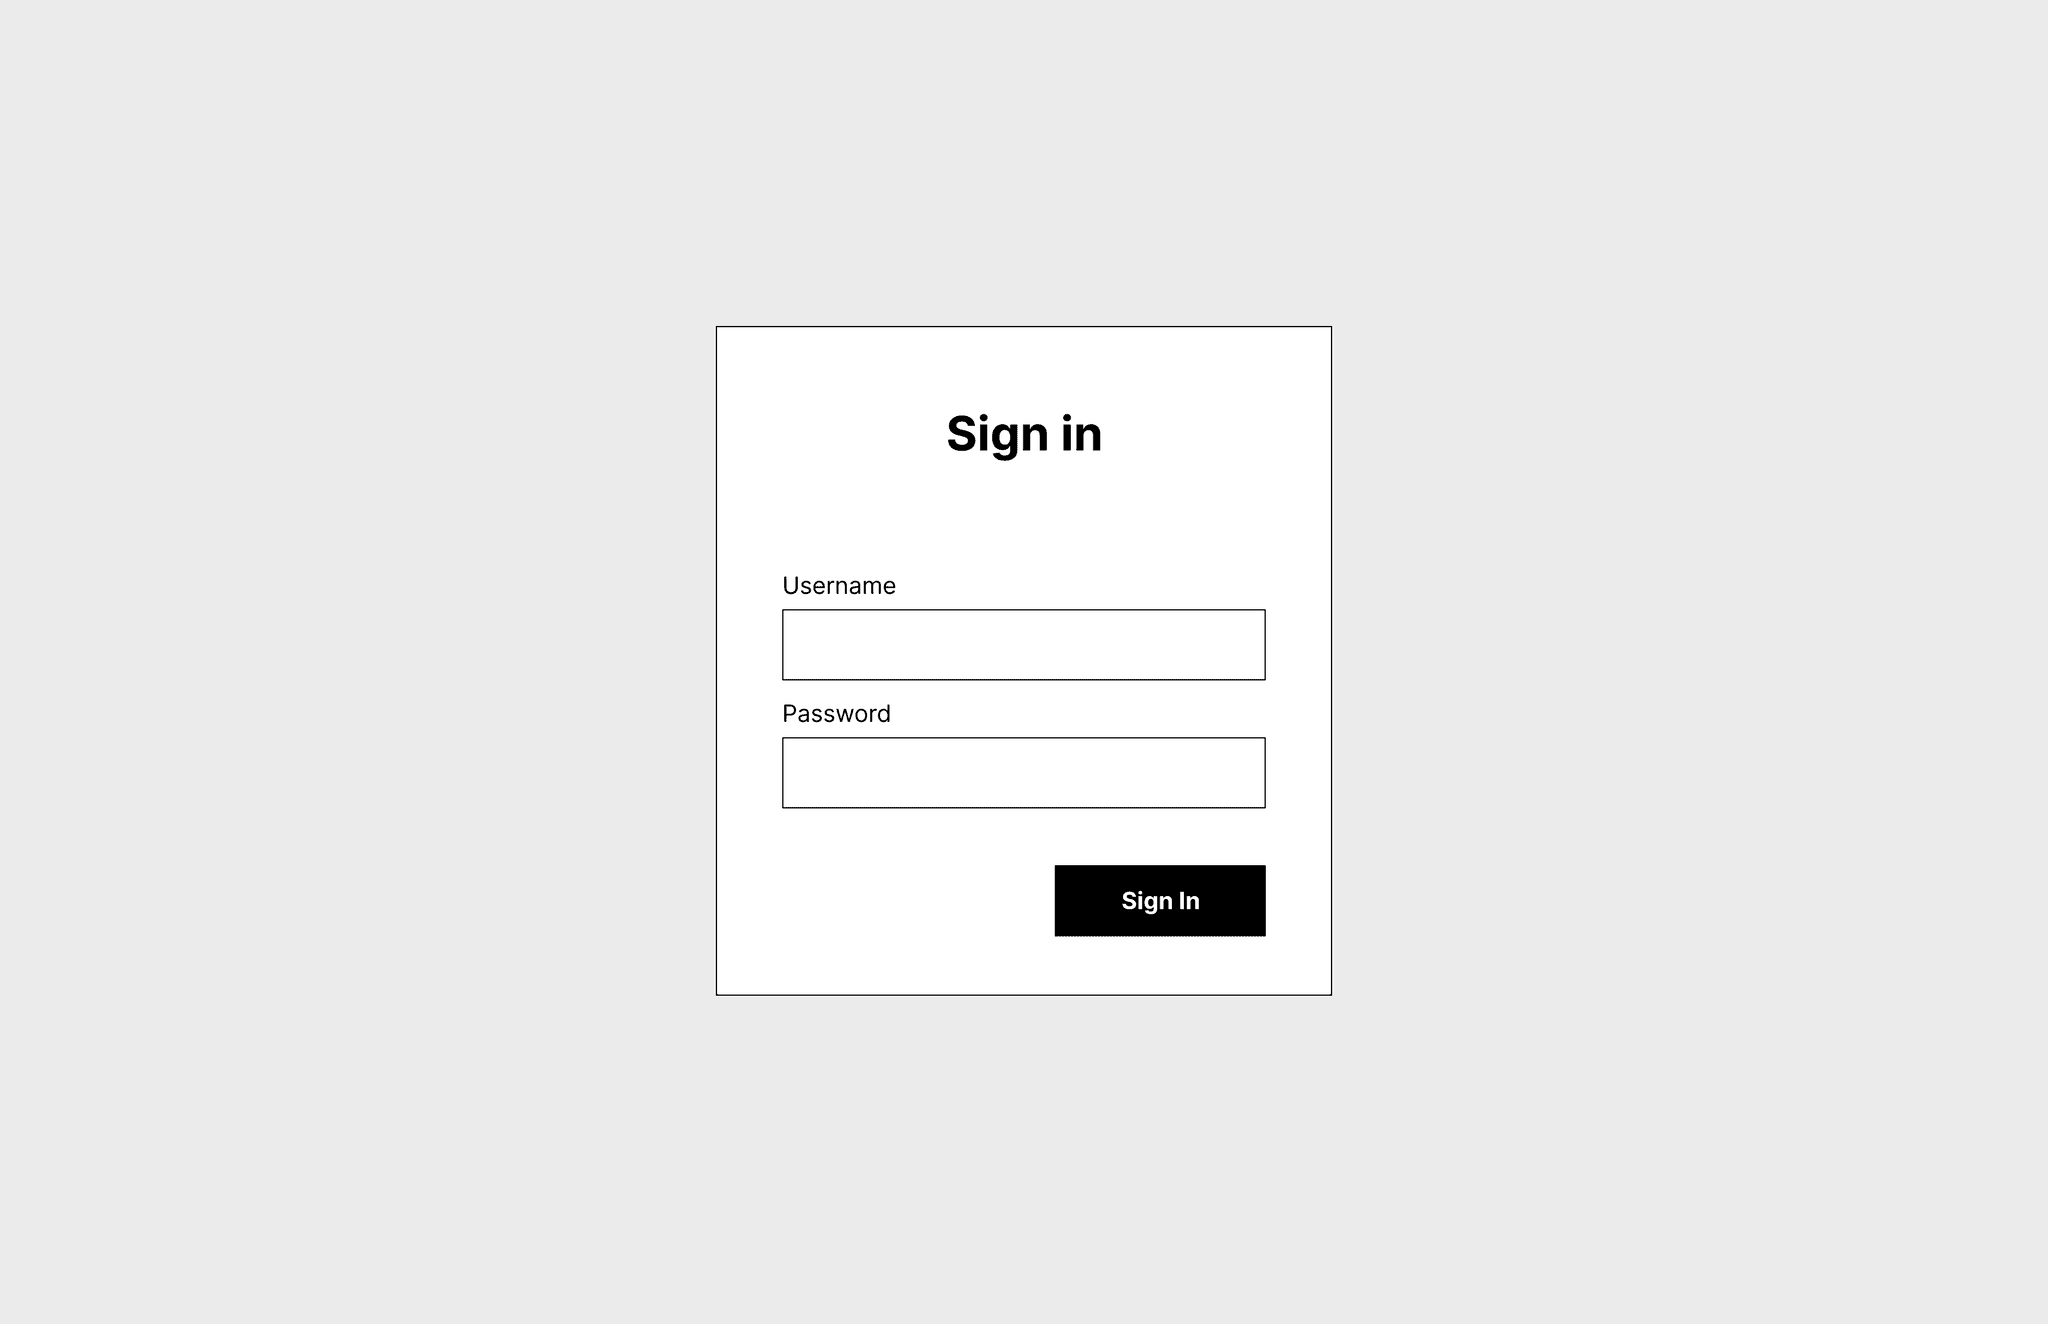
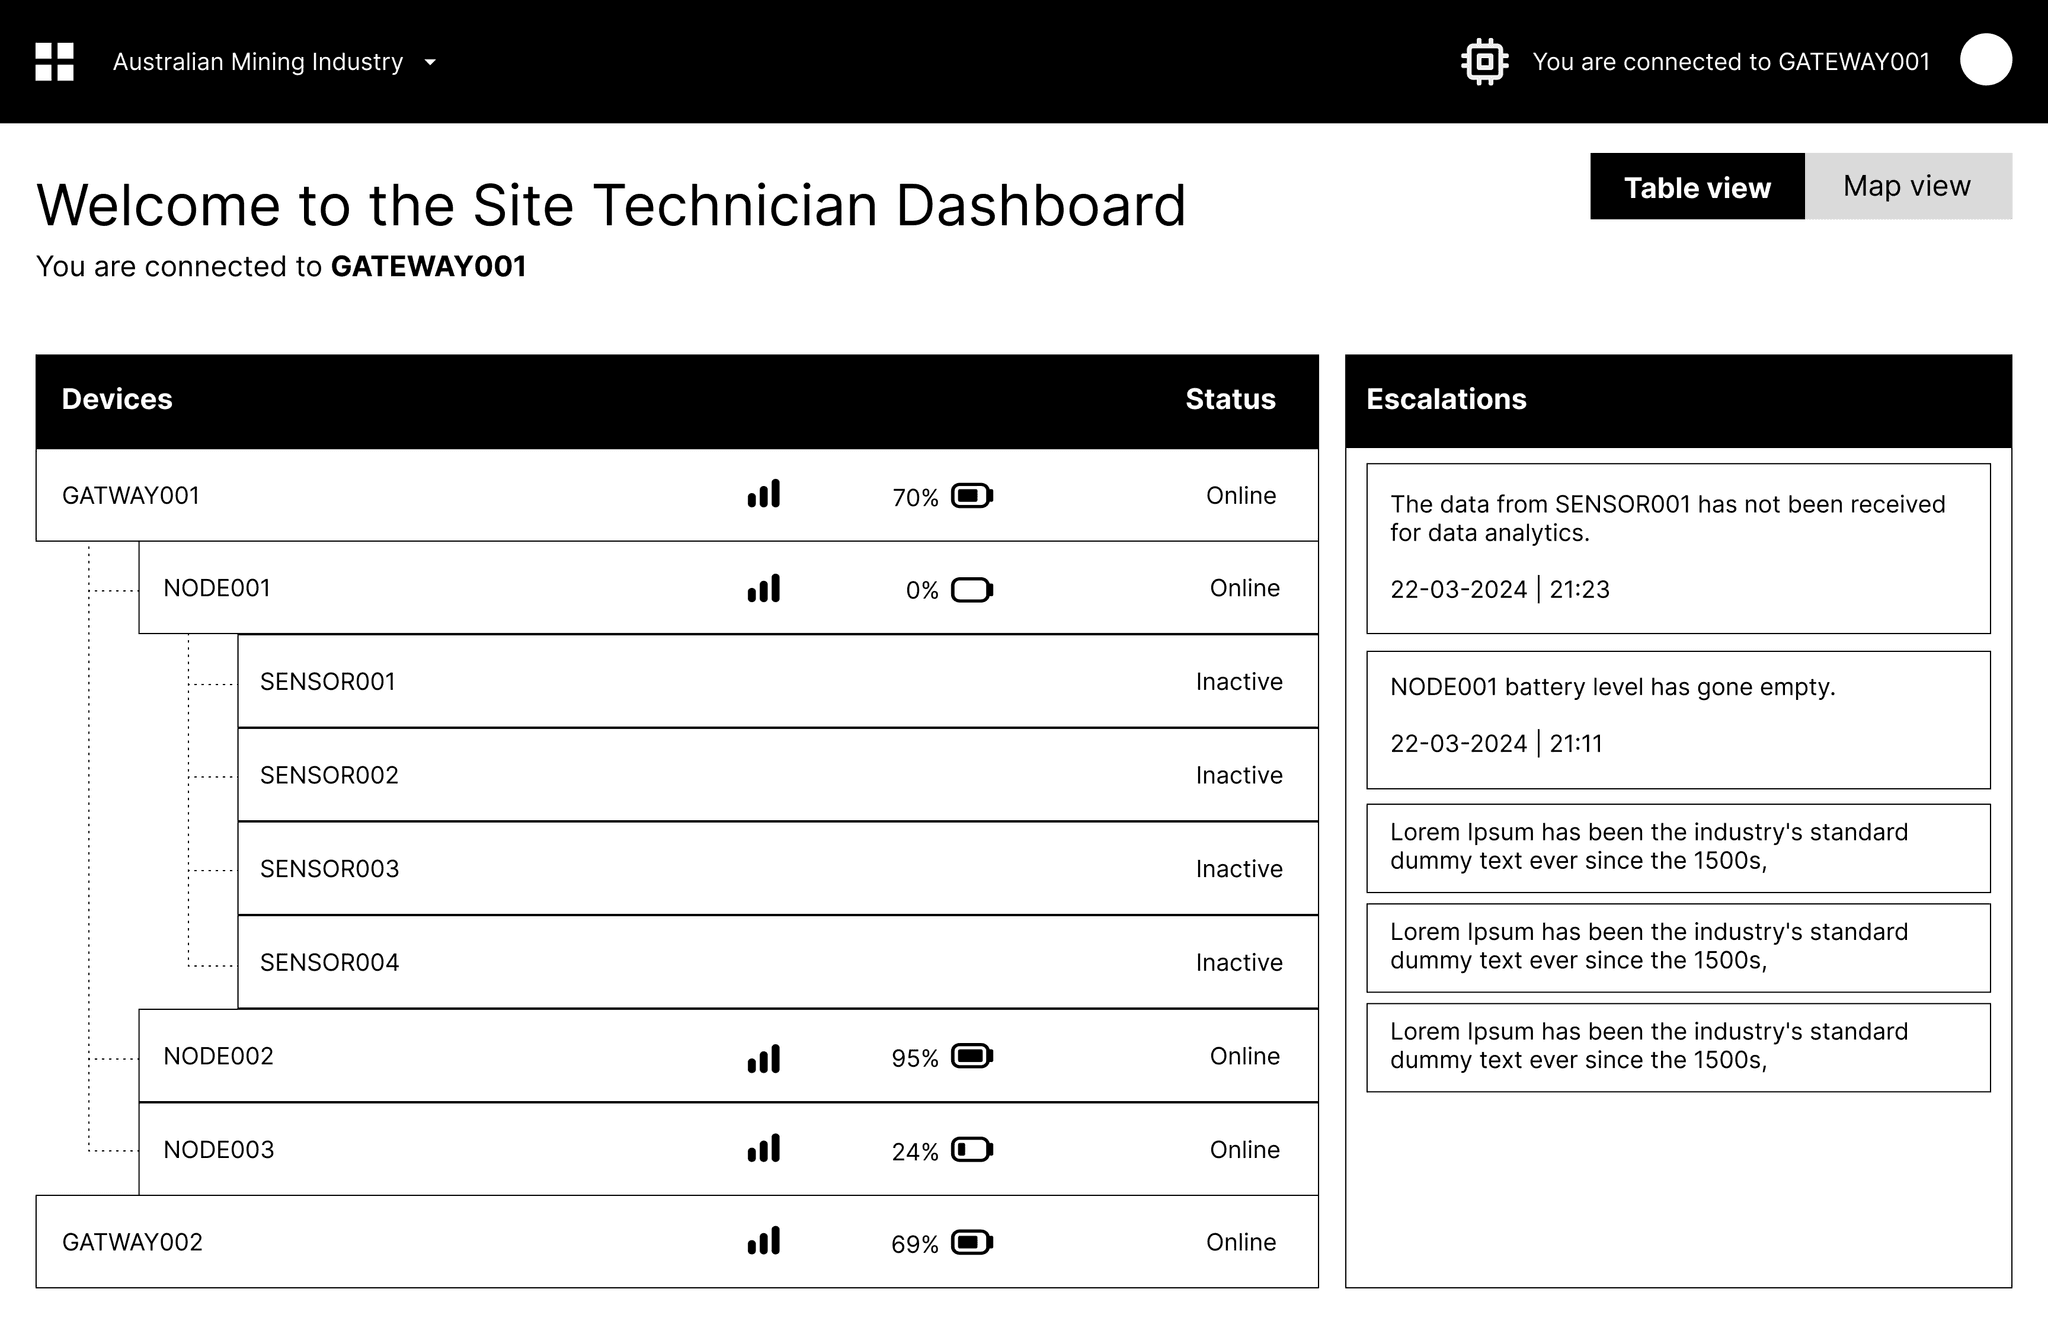
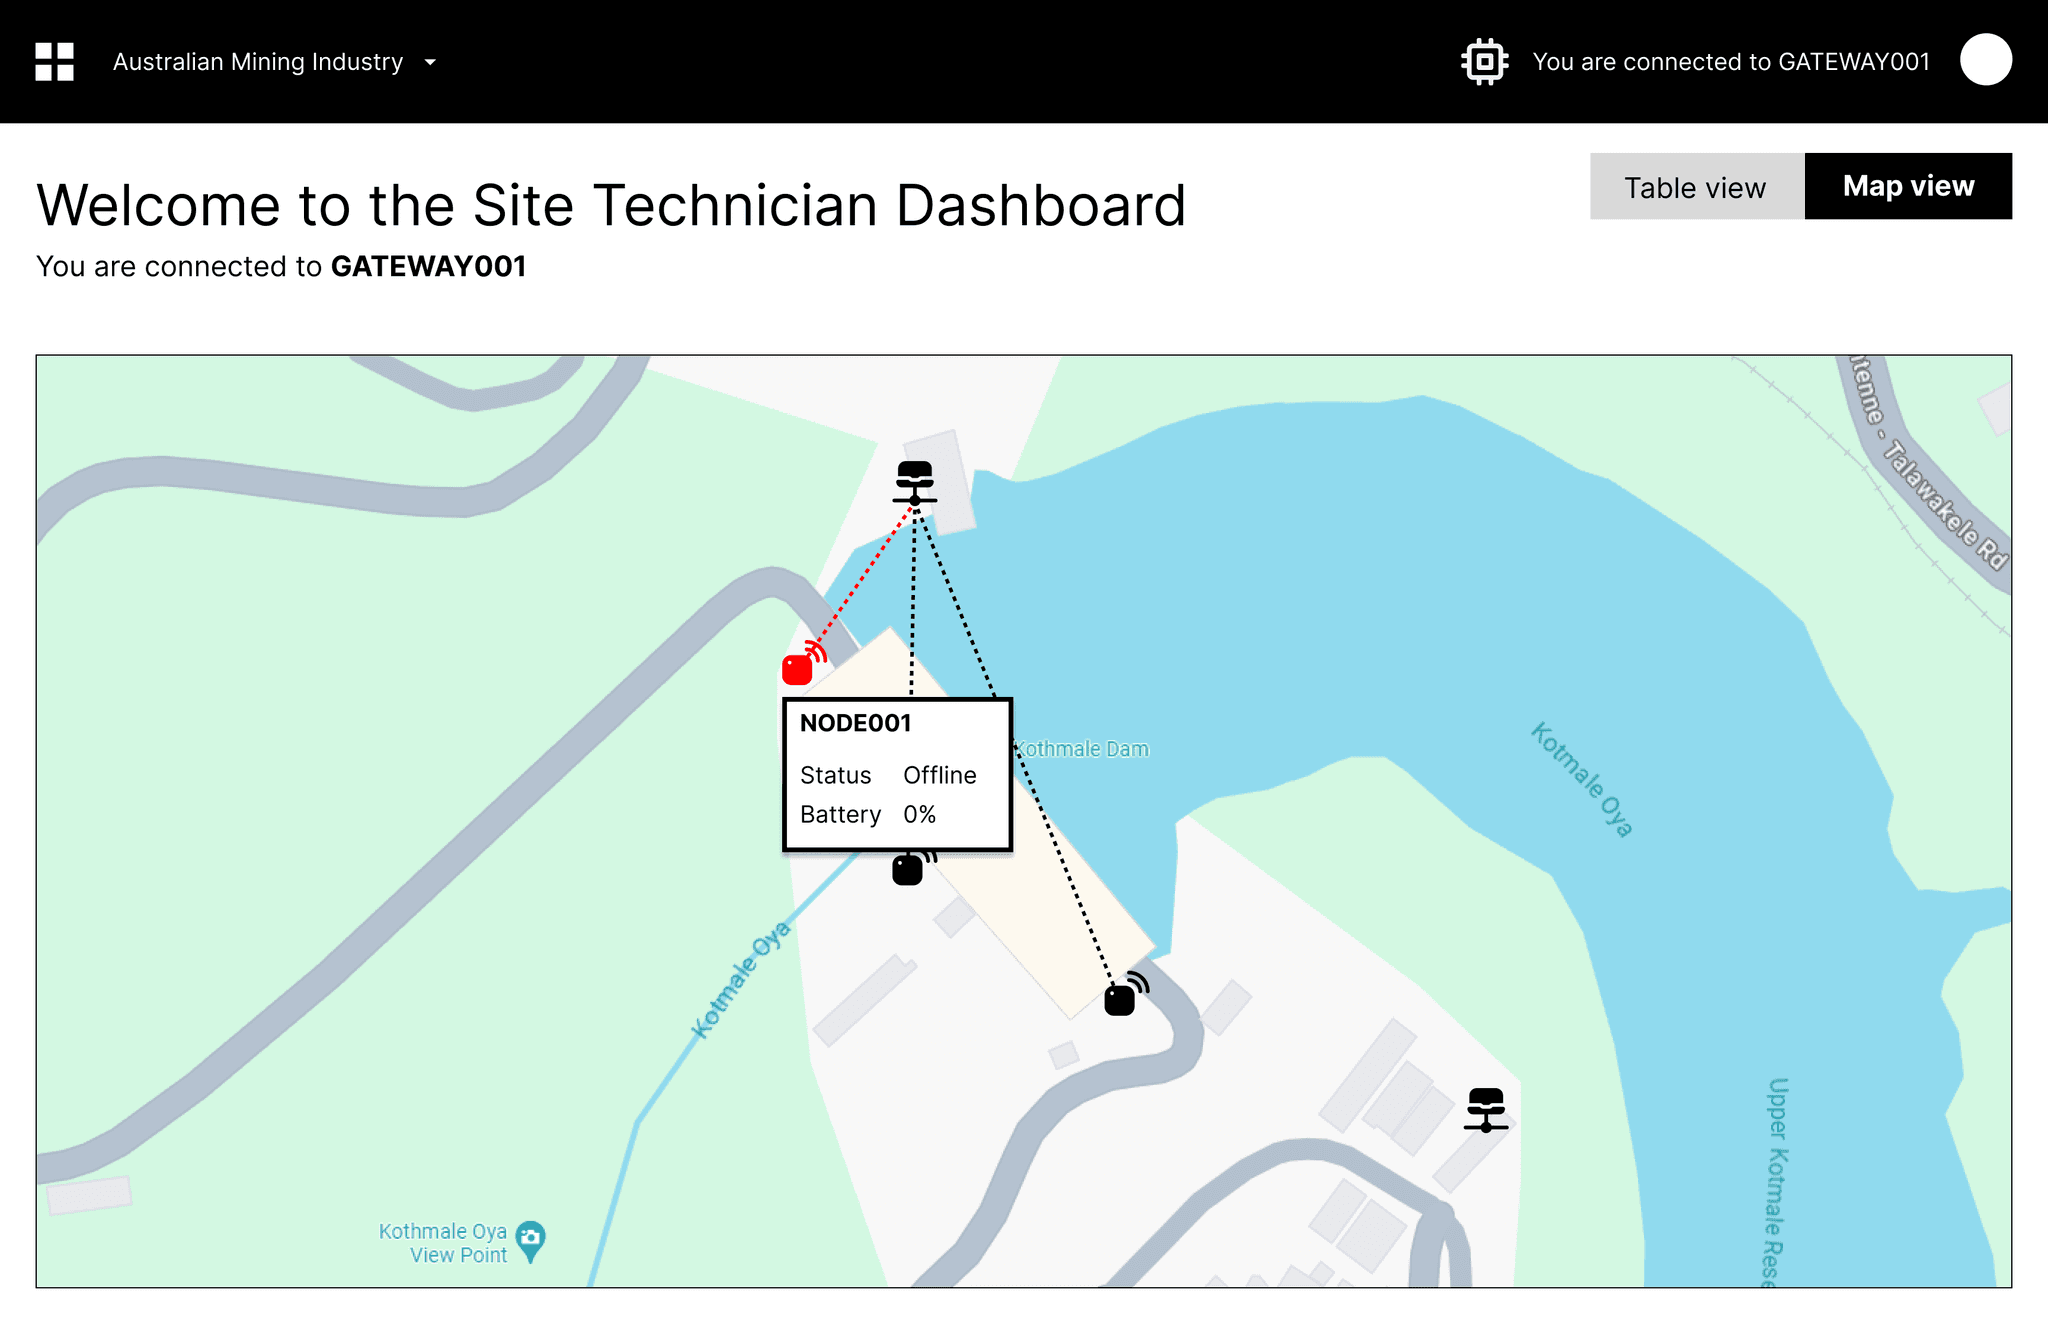
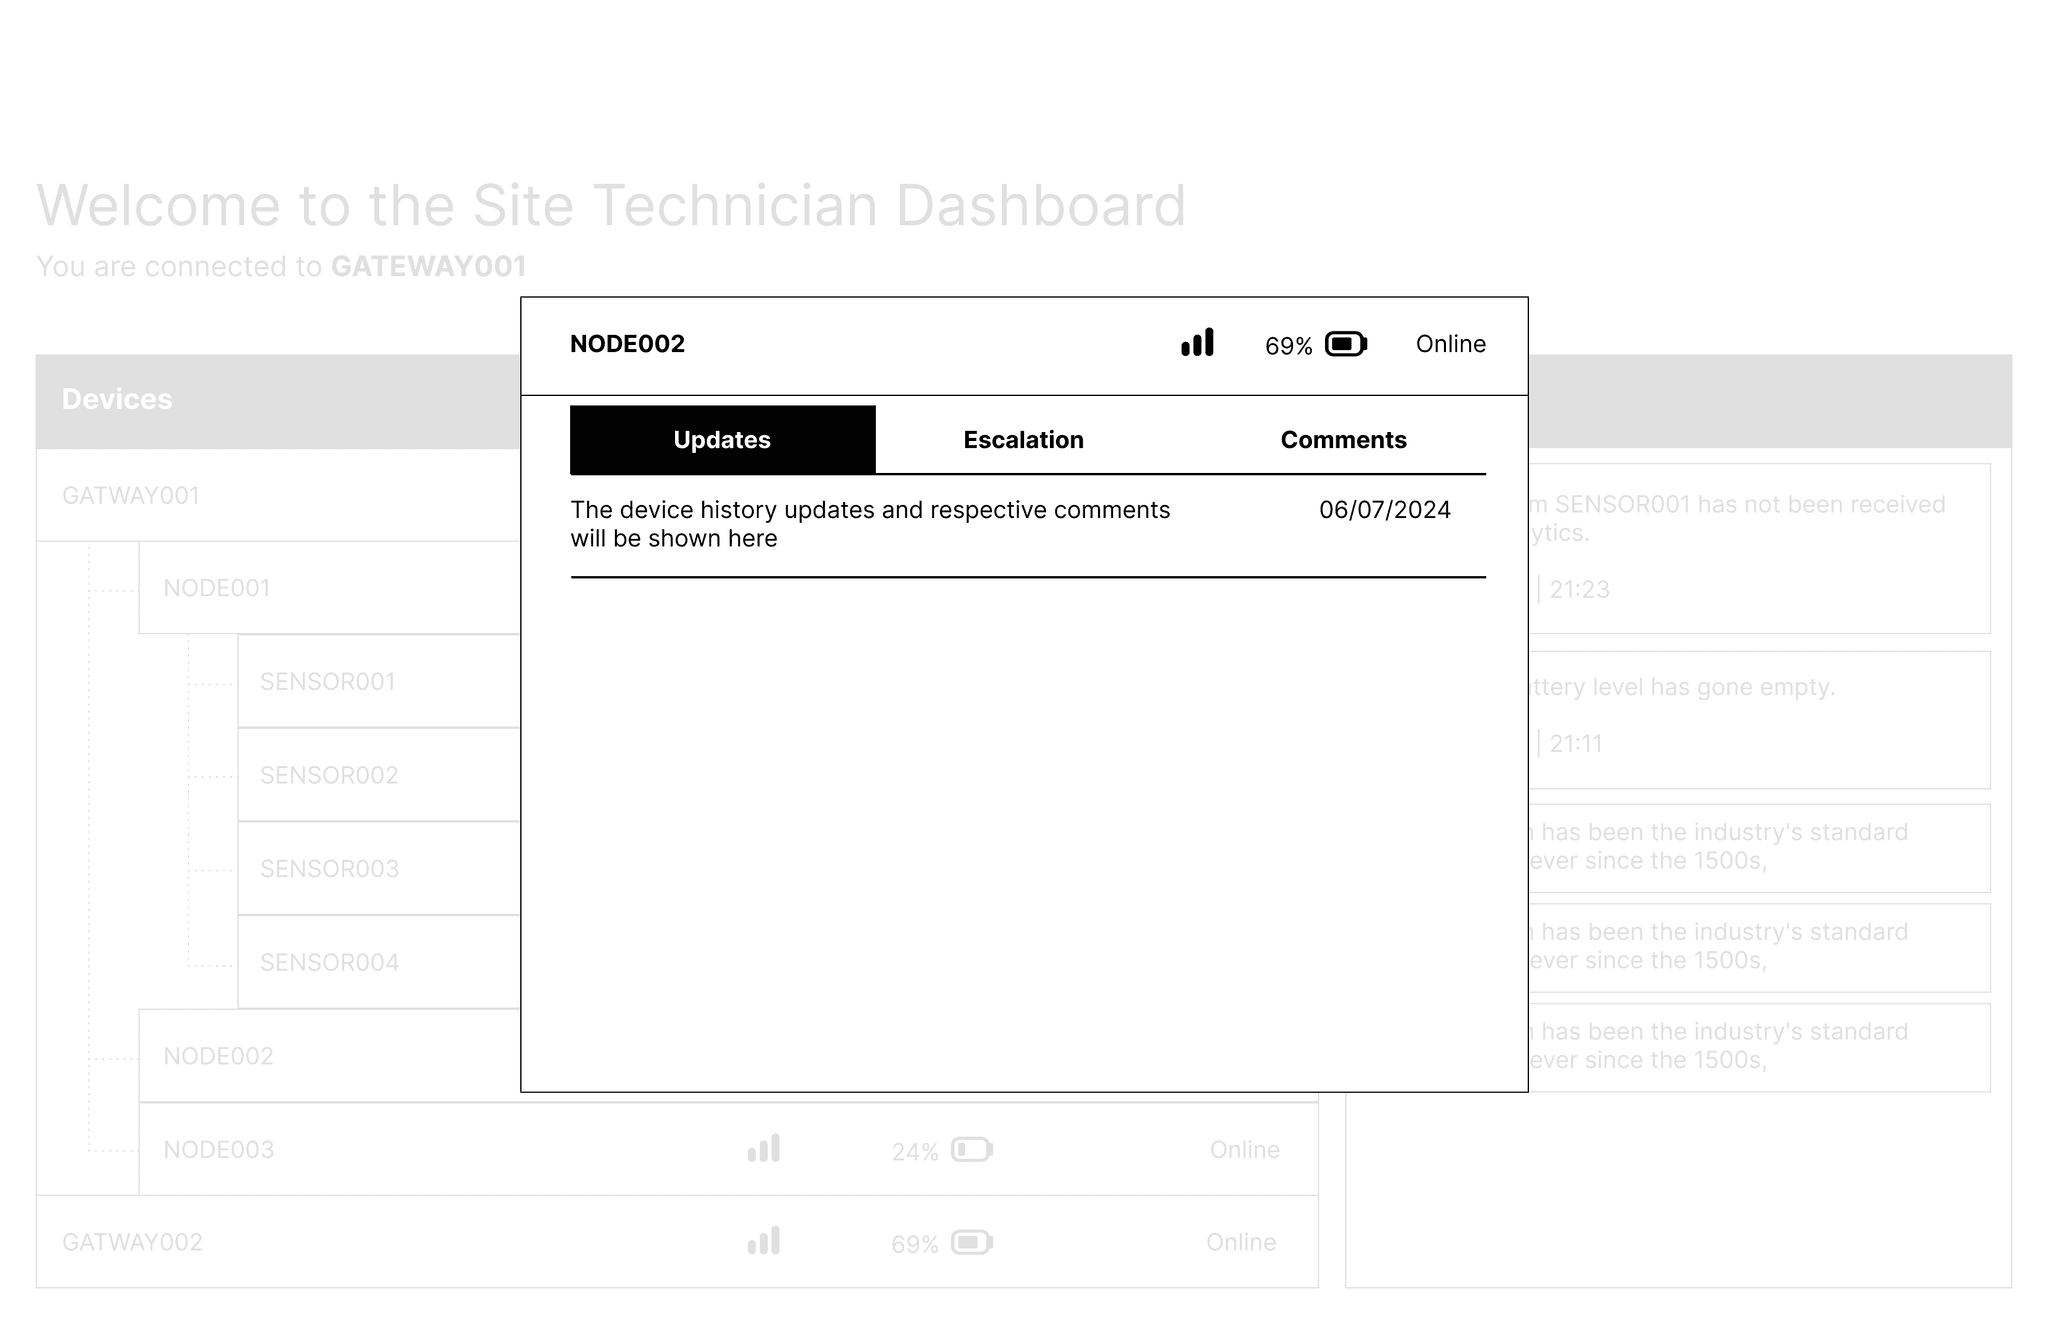
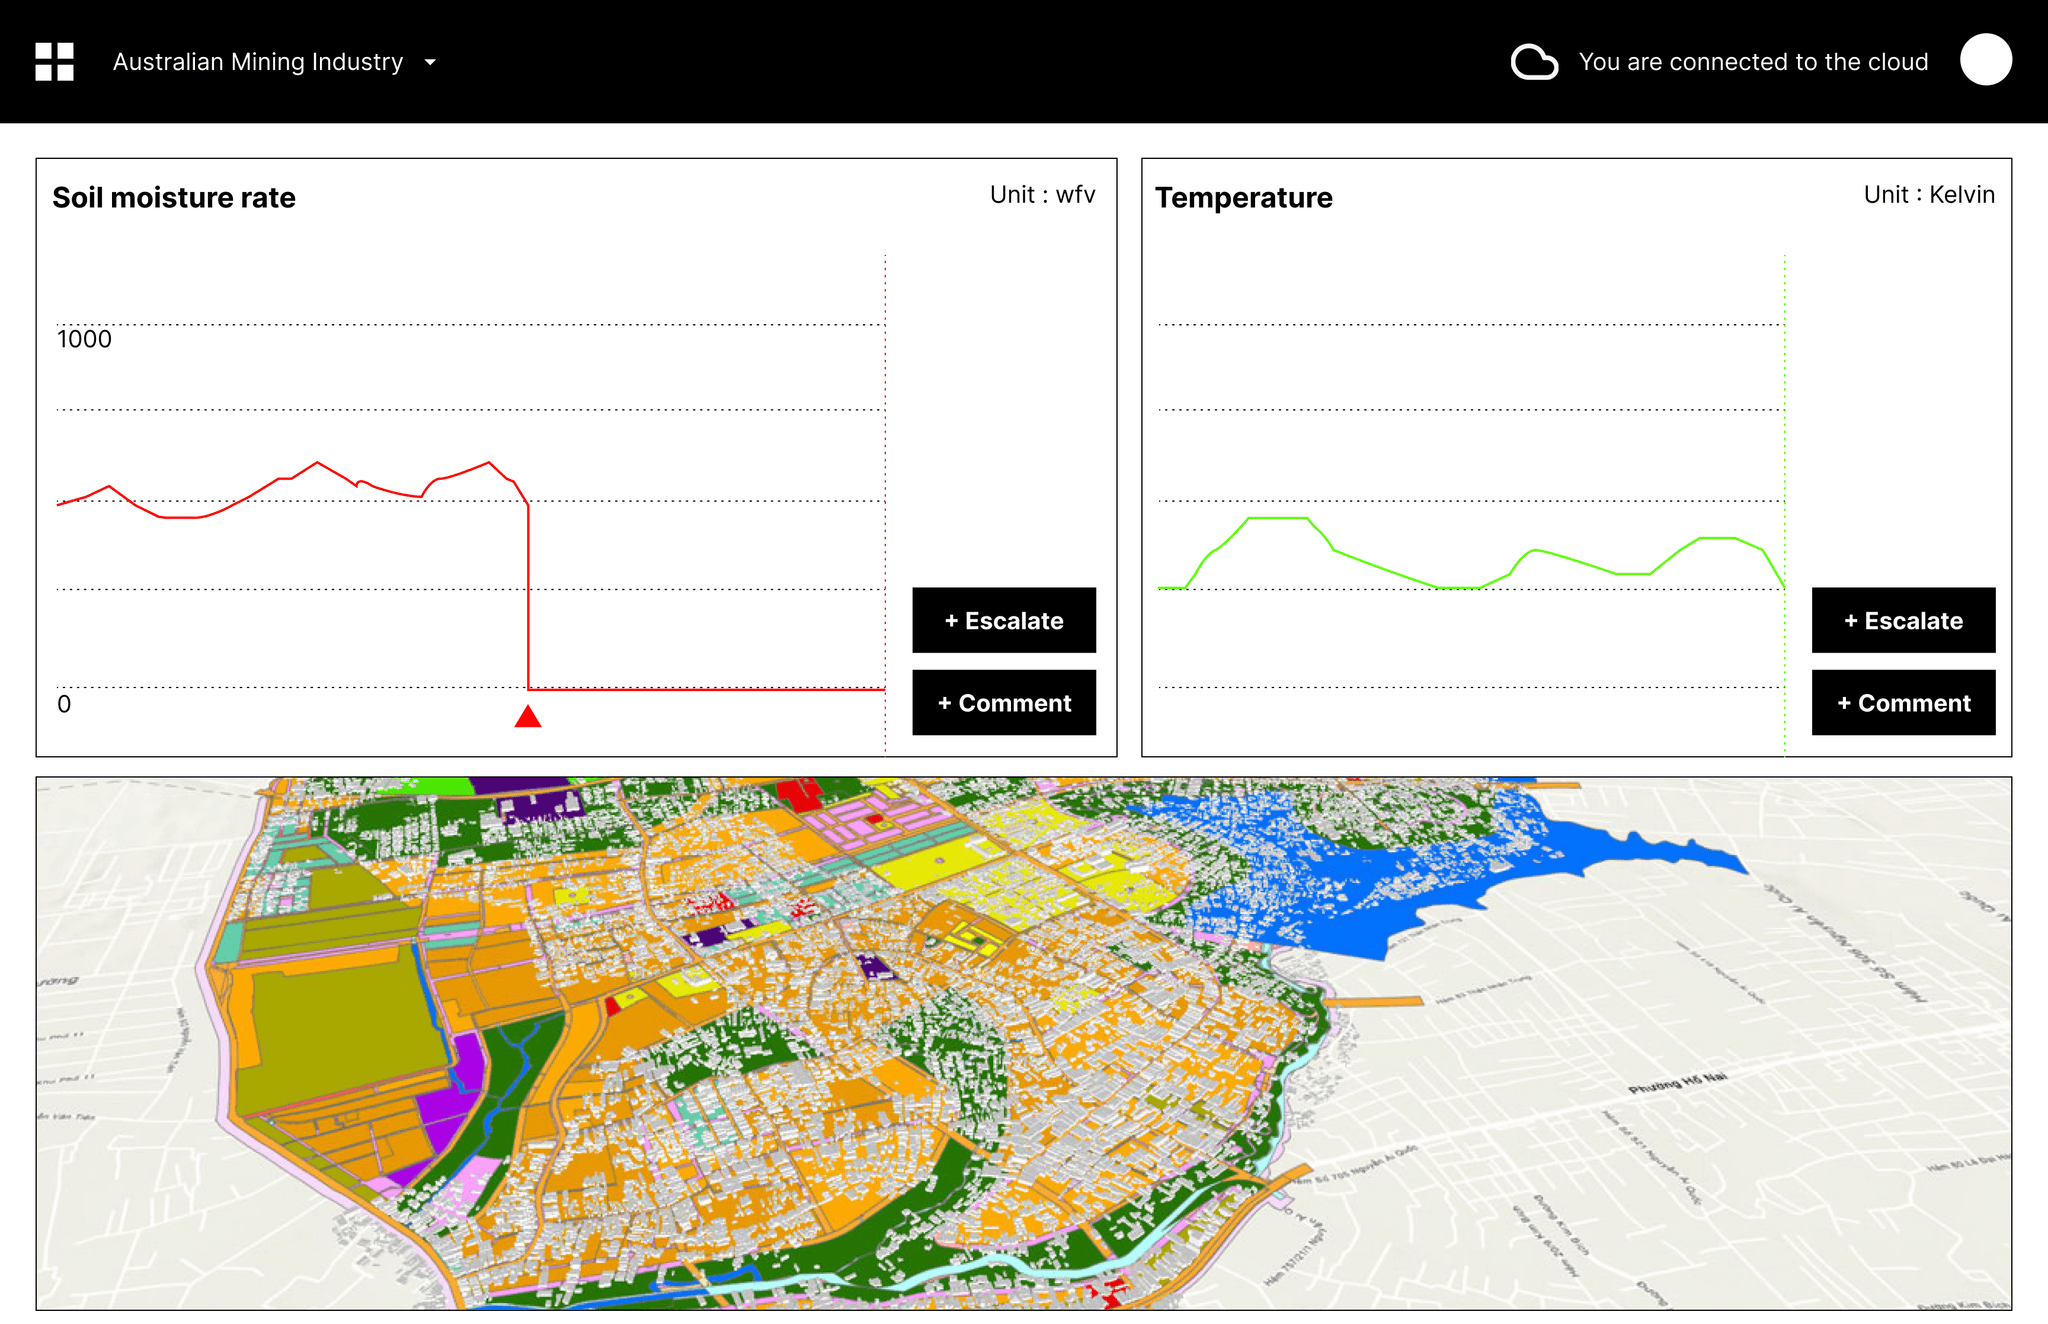
As a starting point a potential scenario which involves John and Alex was considered and the screens were wireframed.
PROTOTYPE
After a thorough process, the final design has been achieved accompanied by a prototype.
Feel free to browse the gallery below or swipe through the carousel to see more.
Or swipe the carousel to see.

